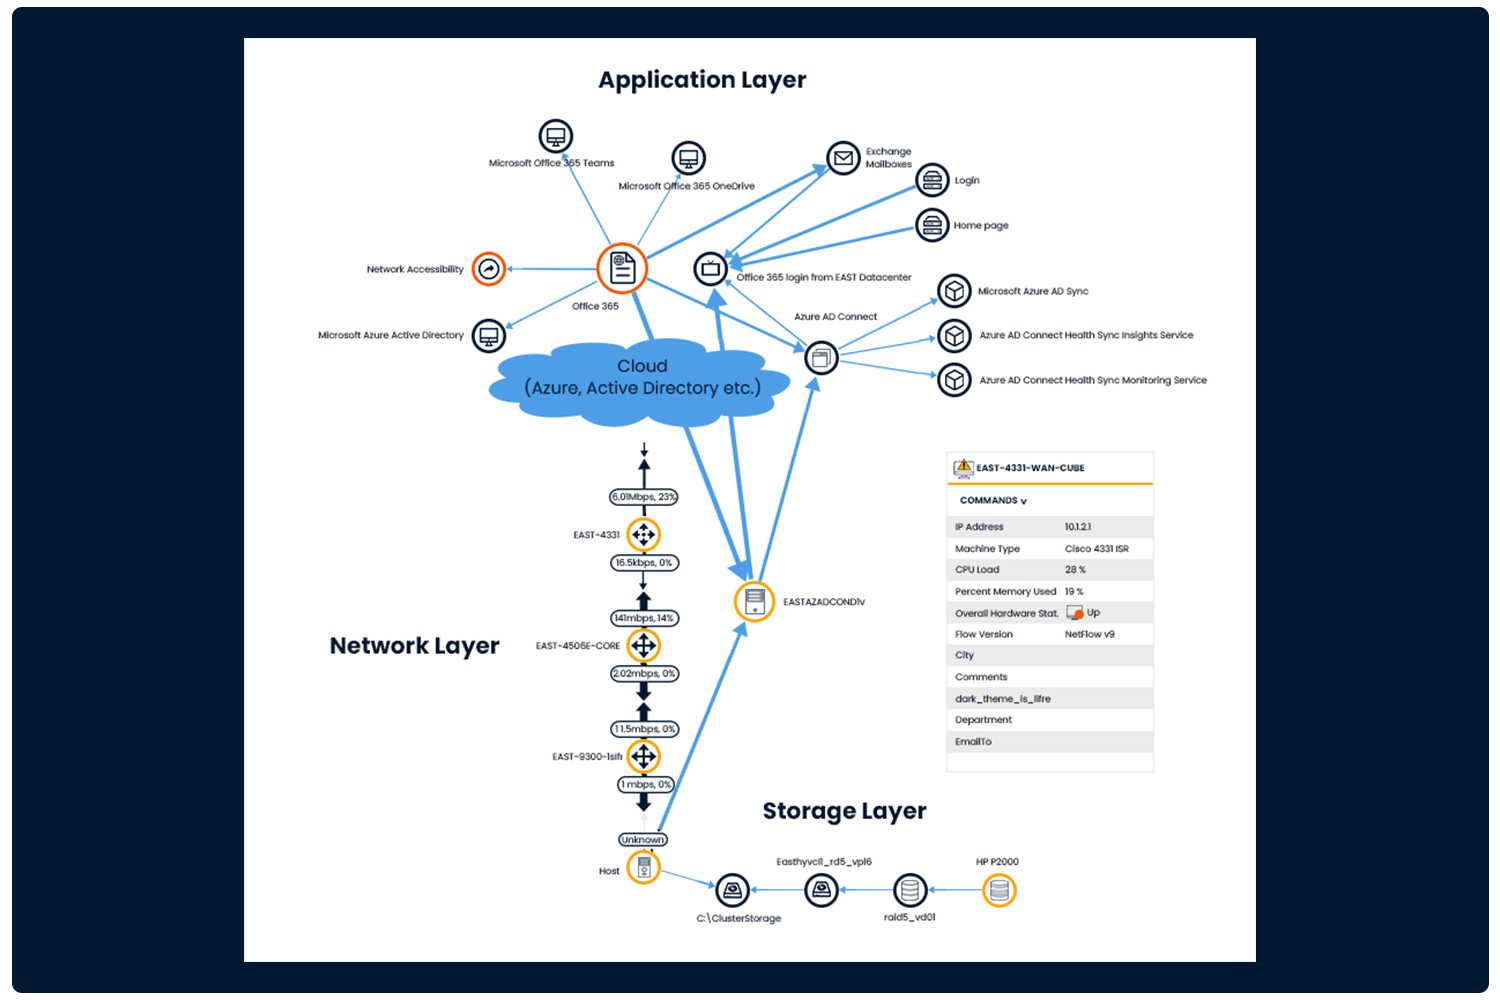
Banking & Financial Services

FinTech

Banking

Insurance

Investment

Continuity is always of great importance in financial services, including banks, Fintech organizations, insurance and investment companies. The development of fintech companies with faster, contactless and cashless service models has introduced new behavioral habits in consumers, further accelerating the transformation and growth in the sector. With all these developments, deeper monitoring and automation needs have emerged in the network, storage and application layers of financial services.

What are the most common questions and requests from IT teams?

Availability

“How can I effectively monitor and ensure availability of my applications in the hybrid, multi-cloud environment?”

Regulations

“How can I meet rapidly evolving and increasingly complex industry compliance standards and regulatory challenges?”

Consolidated View

“How can I ensure all my tools are talking to each other and are giving me the right insights on impact to business services?”

Root Cause

“I need to be able to proactively identify the root cause of the issue and solve it in a time sensitive and agile way.”

Customer Service

“I want to provide the best offers and timely customer service and to retain and attract new customers.”

What does the IT infrastructure of financial services include?

Hardware

All infrastructure components (router, switch, firewall, load balancer, DDoS, san switch, server, container, storage)

Software

All banking applications

Facilities

Bank office locations and anything closely associated with these physical environments

Service parts

All links and accounts used to access sensitive data

Network components

All APIs, external links and data exchange standards

Uninterrupted service guarantee
for all financial services

Monitor your systems end-to-end with the service tree we created

Obtain a Service Scheme structure by associating CIs with each other. Get to the root of the problem with the cause-effect relationship extracted through Query.

Is the physical hardware of the devices using the application working correctly?

What critical processes or services should I follow for the application to work?

During application slowness, which layer (network, application, storage, virtualization, etc.) should I focus on?

View the source of problems in your services

Be informed in real time about outages caused by third parties. Find out the root cause of application or service issues by performing code-level monitoring.

Servislerinizde sorun olduğunda kaynağını nasıl görüntülüyorsunuz?

Sorun dashboard ile kontrol edilebiliyor mu?

Sorun sırasında yöneticiye hitap eden dashboardlar mevcut mu ?

How do you check the cause root of the problem occuring in your services?

Can the problem be checked with the dashboard?

Are there dashboards that specialized to the administrator during the problem?

Create dependency maps of your applications

Gather information about your application dependencies and visualize it in a way you can easily understand. Have tables that list details about the different services your app uses and the connections between them.

Do you know what other interruption are affected by interruption in your applications?

Do you have detailed information about dependency between applications?

Can you know for sure performance bottleneck?

Specialized solutions for financial services!

Meet solutions that increase productivity, improve performance and enhance customer experience!

By monitoring the network get information about current status of network lines, detects anomalies and investigates the root causes of problems.

Unlike standard network monitoring tools, Network Performance Monitoring (NPM) allows us to measure application performance through network traffic. When a problem occurs in an application, it helps us find out whether the problem is client-related, network-related or server-related.

It provides the necessary tools to monitor your servers, applications and their supporting infrastructure running on-premises, in the cloud or in a hybrid environment, on a single web console. It allows you to take timely action to prevent slow applications and downtime from impacting your end users and business services, and helps ensure best practices with built-in server monitoring templates.

It provides custom template collections, application monitors, and alerts to intelligently monitor application status and issues. It is the ideal solution for monitoring over 200 types of applications including application, authentication, database servers and more.

When mapping interactions and relationships between your applications and infrastructure, identify all elements in the IT ecosystem, visualize device applications in a network and how they are related.

ADM is a subset of application mapping that defines which applications connect to what in the context of your entire network. Its goal is to help organizations understand the complex interconnections between various software, hardware and related systems.

Application mapping helps organizations automate discovery of virtual resources. It can give administrators an overview of key dependencies and give IT managers a clear picture of environmental health and overall application performance.

With its structure compatible with ITIL standards, it enables you to provide clear, traceable and measurable support to business units by managing IT Services. SPIDYA ITSM ITIL compatibility provides standardization in your business processes and helps you maintain these standards with its user-friendly flexible design. It offers a measurable and improveable service management experience with effective reporting tools. ITSM reports presented on ITIL processes ensure scalability and help you reduce costs by increasing workforce.

You can access the SPIDYA ITSM application from your smartphones, tablets and browser-supported devices, with its media-independent designs that can be used entirely on the web.

All-in-one solution for comprehensive virtual environment management. Virtualization Manager (VMAN) is a powerful virtual machine (VM) monitoring tool designed to consolidate a variety of useful observations into a single interface. VMAN provides comprehensive visibility into the health and performance of VMware vSphere, Nutanix AHV, and Microsoft Hyper-V hypervisors, whether on-premises, hyperconverged, hybrid, or in the cloud.

Easily manage the health of your entire environment, whether server, virtual or storage infrastructure, and troubleshoot specific interrelated issues from a single perspective.It provides custom template collections, application monitors, and alerts to intelligently monitor application status and issues. It is the ideal solution for monitoring over 200 types of applications including application, authentication, database servers and more.

SolarWinds Web Performance Monitor monitors user experience from anywhere, testing operations for internal and external websites and web-based applications. It allows you to quickly identify slow or faulty items, then troubleshoot the supporting infrastructure, from the web server and database to the storage hardware.

Easily manage the health of your entire environment, whether server, virtual or storage infrastructure, and troubleshoot specific interrelated issues from a single perspective.

It provides custom template collections, application monitors, and alerts to intelligently monitor application status and issues. It is the ideal solution for monitoring over 200 types of applications including application, authentication, database servers and more.

Thanks to automated processes, it provides in-depth visibility into problem identification and resolution needs. It offers enterprise observability to improve application performance management and accelerate CI/CD pipelines regardless of where applications reside (public cloud, private cloud, hybrid cloud, on-prem, etc.). Thanks to Observability, you can combine APM with automation capabilities and deploy it as an on-prem or SaaS solution. By presenting data in context, it makes it possible to see the results of changes made in real time. Moreover, it offers artificial intelligence that helps analyze and solve problems that may arise. And it provides ease of use carefully designed so that all teams can easily use observability tools.

How did Paynet achieve efficiency in its IT infrastructure with SolarWinds SCM (Server Configuration Monitor), NCM (Network Configuration Management) and VMAN (Virtualization Manager) solutions?

Check out our blog posts for detailed information about the solutions!

Contact us for more information!

Please enable JavaScript in your browser to complete this form.
Name - Surname
BT Hizmet Yönetimi NOC Sistemleri