How to Create Dynamic Application Dependency Maps in 3 Steps with Turbonomic
Can you tell clearly how many times you have received complaints about apps crashing or slowing down? Crashing or slowdown is a big problem, but the hard part is finding the root cause of the problem that caused it. How do you know if it’s code or a resource issue? Or how do you know what dependencies the application has on whatever it uses in your cloud or virtualization environment?
Turbonomic is the key! It can reduce troubleshooting time (MTTR) without the need for APM or special skills; you can have a complete, dynamic view of the entire application and resource supply chain.
Setting Up a Service in Turbonomic with ATD
Let’s say you have a shared SQL server or some shared service somewhere in your environment and let’s use that to get started.
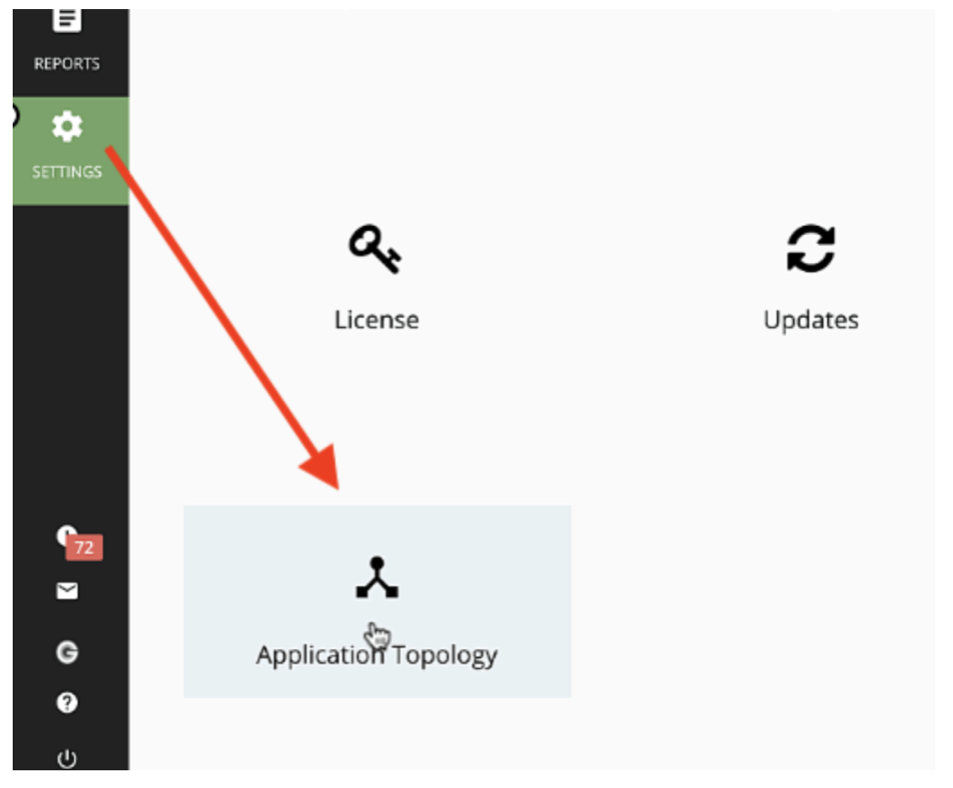
Open your settings and click the “Application Topology” icon to get started.
With ATD, with a few simple clicks, we will be able to dynamically associate the service with the applications it supports. In this way, we ensure that all key resources are automatically and dynamically mapped to the high-level business application.
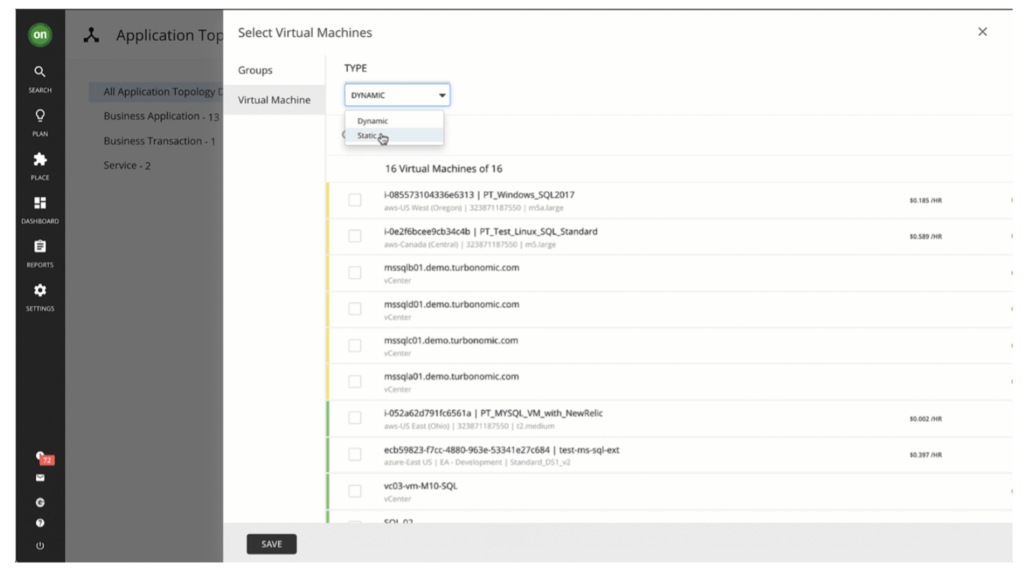
In order to choose the servers that make up your service, it will be enough to choose it as a dynamic or manual query with your selection criteria. For our example we use SQL Cluster and put the virtual machines in our service definition.
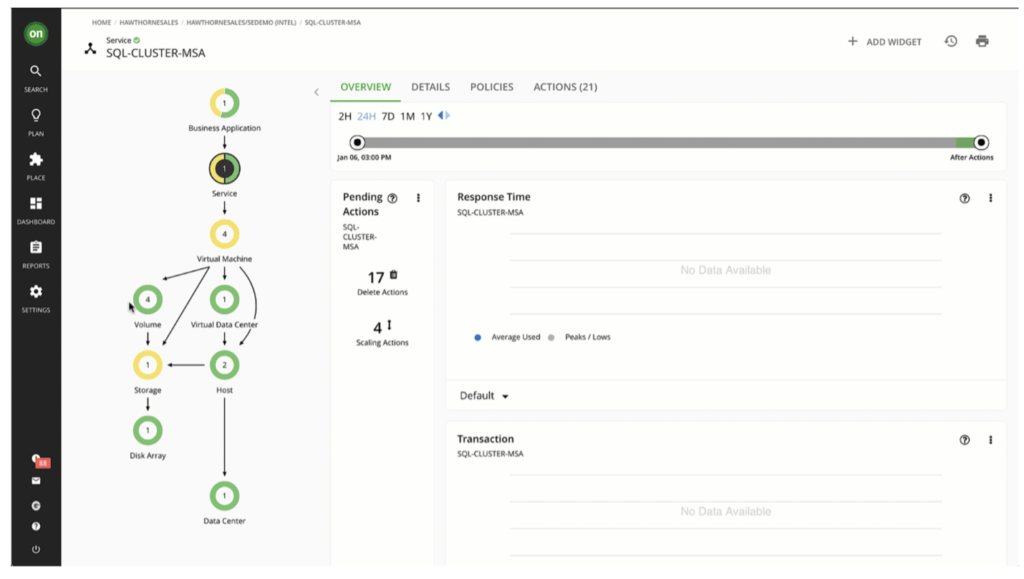
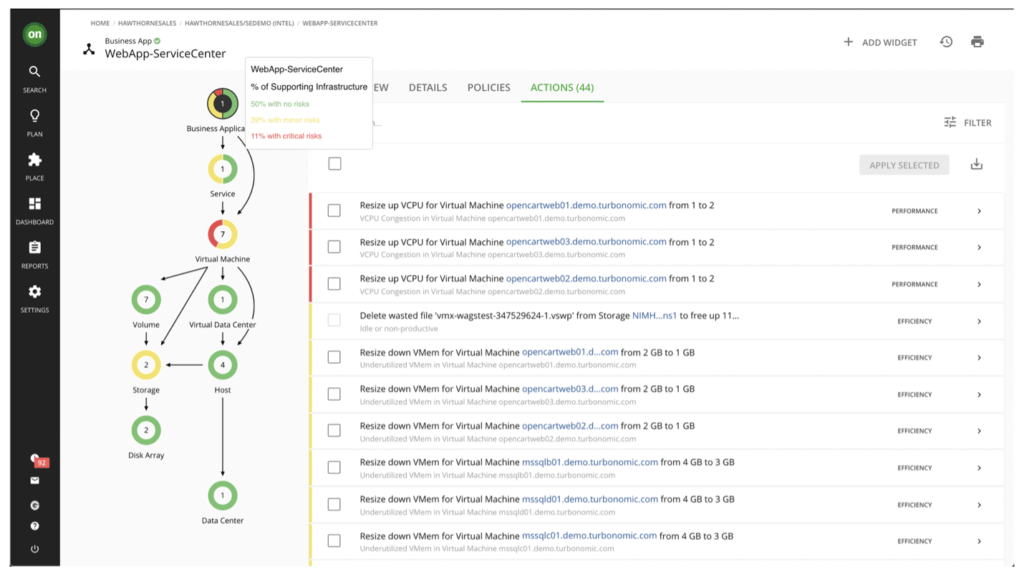
We will have a service defined in Turbonomic that has both the visualization of the full resource dependency map and the overall health of the top application is dependent on the cumulative health and risk from the child resources.
This is especially useful when you click on the layers and you can see the relationships, usage metrics. You may find that the storage issue has an impact on the business application because the SQL service depends on it and may be affected, causing latency in your application.
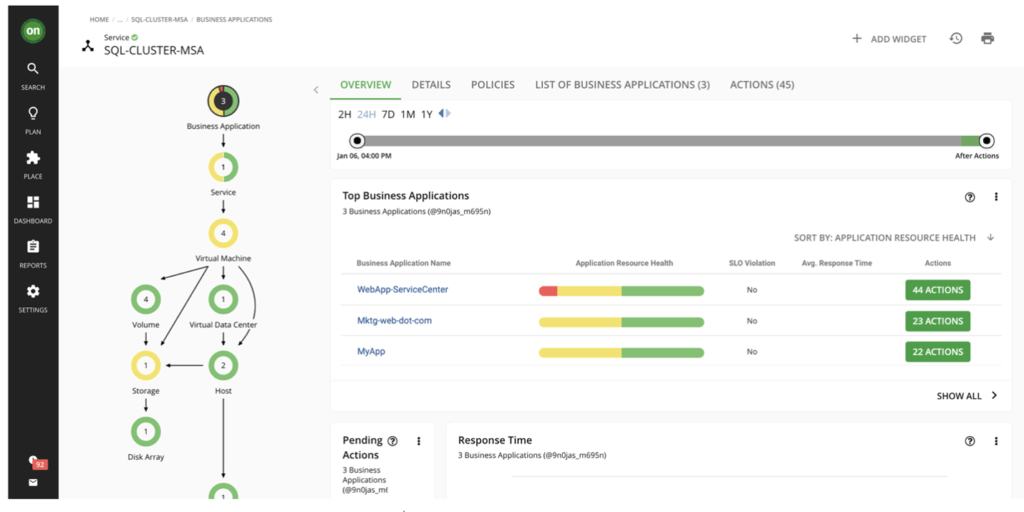
Let’s go one step further. Let’s consider that this is a database service that provides shared access to databases for many applications. By using ATD to identify our other business applications in just a few clicks, you can see all the dependent applications that rely on this SQL (or any) service layer.
All of this is done using out of the box capabilities, and no APM is required to define your applications. Even if you have APM platforms, you probably don’t have full coverage for all your applications due to the complexity and cost of doing so.
With just a few clicks for each manual application definition, you have an incredibly valuable, dynamic visualization of your application’s risk based on resource usage, health, and any adjacent resources that can impact each application.
Actions Speak Louder Than Words (or Visualization)
Seeing these relationships and maps is a great ability to help your IT team. It is designed to create the first glass pane for you to look at the health, performance, and efficiency of any part of your IT environment. By the way, we should mention that this works on any infrastructure, whether on-premises, in the cloud, or container. IBM Turbonomic APEX is fully flexible to cover any part of your environment, automatically tags your resources in the IBM Turbonomic Data Cloud platform for a zero-touch experience. You can instantly access and take action on sourcing actions that will ensure the health, durability and efficiency of your application.
Contact us for more information about Turbonomic!