Analyze issues and what is affected through your infrastructure or applications data!

Providing the transparency of a multi-layered environment and achieving rapid root cause analysis only with an overall holistic infrastructure view

Discovers and collects information needed for solution so you can find out why issues occur

Being observable means enabling a system to be understood and measured in a complex micro service architecture

Provides advanced root cause and anomaly detection by automatically correlating data

The Road to DevOps Success

Observability gives DevOps teams the flexibility they need to test their systems, ask questions, and investigate issues they couldn’t initially anticipate.

web-design

Create SLOs and deploy tools to prepare for measurable success

infinity

Gather around team dashboards, organize responses, and measure the impact of each change to improve DevOps practices

cardiogram

Review progress, analyze application dependencies and infrastructure resources; find ways to continually improve the experience of software users

Application Performance Management

Provides enterprise observability to improve application performance management and accelerate CI/CD pipelines, regardless of location.

Highlights of Application Performance Management

Accurate, real-time data

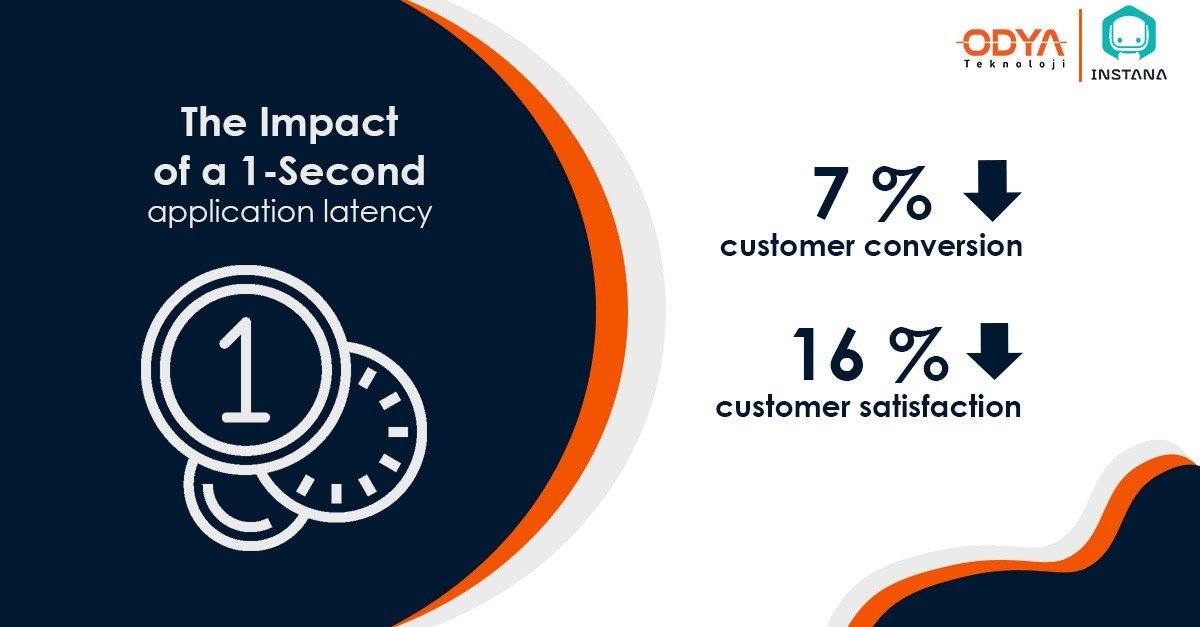
Get 100% distributed monitoring, 1-second metrics, instant software deployment pipeline, and CI/CD feedback.

Continuous, real-time discovery

Access a single architecture for micro services and infrastructure with 250+ domain-specific sensors.

Powerful and easy-to-use data analytics

Generate new insights with infinite flexibility from the entire repository of application request tracking data.

Dependency mapping of apps

Automate dependency mapping across the entire application stack for flexible application perspectives.

Root cause analysis automation

Automate event correlation, including analysis of performance, errors, changes, and SLA-related violations.

Application Resource Management

Let your applications get the resources they need, when you need them! Gain visibility, insight and actions at every layer of the application and infrastructure stack without human intervention with Application Resource Management.

Visibility

Application Performance Management integrates with systems in the IT infrastructure and receives application assets as a business transaction, service application, and application component. After infrastructure dependencies, risks, and actions are discovered, they are associated with the application, which bridges the gap between the application and the infrastructure teams. It then determines which resources contribute to user response time and throughput and takes action to avoid contention

Insights

Maintains target user response time and experience for your applications by adhering to configuration policies, and uses your resources wisely

Action

Generates reliable actions by matching application demand with infrastructure supply using multidimensional KPIs. It can automate actions at scale for on-premises virtualized, public cloud, and Kubernetes environments. Application Performance Management generates real-time actions to eliminate congestion at every layer of the stack while ensuring application performance

Highlights of Application Resource Management

Automation support

Creates actions before application performance is adversely affected

Optimization

Continuously matches application demand with multiple cloud infrastructure resources to simultaneously optimize application performance and usage

Reliable actions

Identifies which resources contribute to user response time and bandwidth and determines actions to be taken without performance problems

Saving

Maintains target user response time and user experience for our applications, adheres to configuration policies and saves money

Application Dependency Mapping

Given the increasing complexity of IT systems, organizations are increasingly using proprietary software to map their dependencies. Not only visualizes information in tabular form, but also provide visual representations of entire application ecosystems. Dependency Mapping is the process of collecting and displaying information about all application dependencies in an easily understood way. Lists details about the different services the app uses and links them

What is Application Dependency (ADM)?

In a complex IT environment, application mapping or network discovery tools known as Application Dependency Mapping (ADM) are critical. Application Dependency Mapping, all instances, communication channels, applications used in your IT ecosystem; It can define up to the details of the port and service used and map it. Best solutions can also quickly and easily identify VPCs, subnets, and security groups in cloud providers such as AWS, Azure, and GPS

Your application dependencies displayed on an intuitive map with ADM; you have a visual representation of it that can be shared, reviewed, or used for planning and troubleshooting. You can use this visualization to tailor business strategy and business context, prioritizing critical alarms and information in real time

Why Your IT Ecosystem Needs an ADM?

Inventory and network mapping alone are not enough to handle the complexity of modern IT. Organizations need clear insights into the actual functioning of their applications

ADM helps teams see what impact a change in the chain could have on others. In order to fix the problems more quickly and efficiently, it is necessary to have an idea about the health of all applications, easily identify the failure points and prepare the best action plan

Why Your IT Ecosystem Needs an ADM?

Highlights of Application Dependency Mapping

Faster response to problems

ADM has a number of features such as the ability to view previous versions of maps before encountering any issues. Thus, when you observe a problem, you will be better informed about how to deal with them.

Better service visibility

Provides IT operations teams with a useful reference point for optimizing resources, diagnosing & resolving issues, dealing with security incidents, and maintaining your technology services catalog.

Current and complete information flow

ADM constantly monitors your app's dependency inventory, keeping you informed that your maps are always up-to-date and complete.

Identified performance bottlenecks

Helps you reduce the time it takes to find root causes of application performance issues such as slow SQL queries, misconfiguration, or insufficient resources.

Performance bottlenecks

Helps you to develop apps with less addiction. Allows you not to depend on specific versions of software and operating systems. That improves the stability of your software and becomes more tolerant of events and changes at other points in the application stack.

Monitoring vs Observabilitiy

Monitoring

  • Reactive.
  • Monitoring is an operational tool.
  • Alerts relevant IT teams when an event occurs.
  • Network performance, CPU metrics, system memory, etc. provides data.
  • IT teams must manually correlate data and find problems.
  • It cannot determine the cause of the event.
  • Examines the performance of infrastructure and applications and reports problems.

Observability

  • Proactive.
  • Observability is an operational tool.
  • When an event comes to the media, it warns the relevant IT teams.
  • Network performance, CPU metrics, system memory, etc. provides data.
  • Detects processes causing CPU spike by correlating data.
  • IT teams don’t have to do manual intervention, observability does these tasks automatically.

Find answers to the following questions with Observability;

What systems did a service go through?

Has the expected action been taken?

What are the performance bottlenecks?

What is the root cause of the problem?

Check out our blog posts about Observability!

Contact Us for detailed Information about Observability!

Please enable JavaScript in your browser to complete this form.
Name - Surname
BT Hizmet Yönetimi NOC Sistemleri