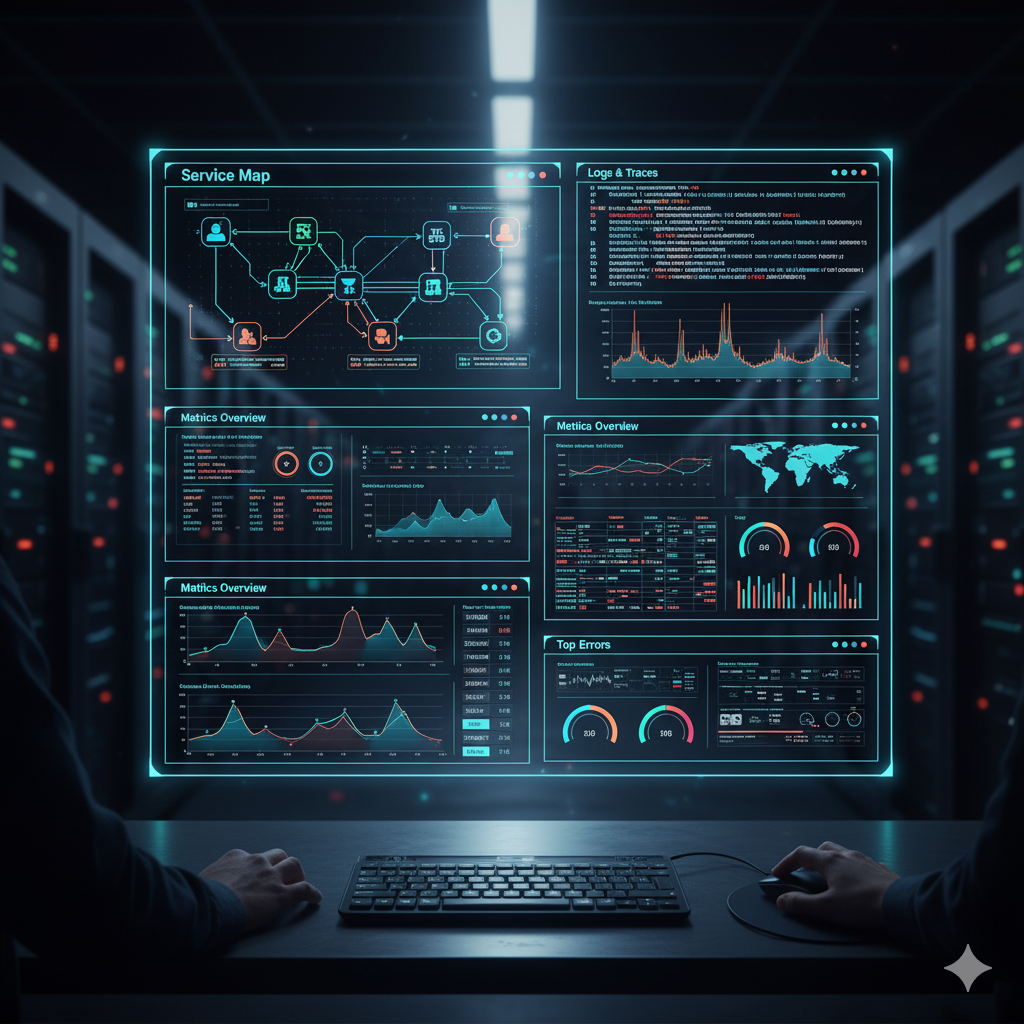
Monitoring vs. Observability: Similarities and Differences
Modern IT environments are no longer simple. Microservices, container orchestration (like Kubernetes), edge nodes, and hybrid cloud architectures make visibility more complex than ever. That’s why merely monitoring systems is no longer enough, we also need to understand why they behave a certain way. This is where Observability comes in. In this article, we’ll explore the relationship between Monitoring vs Observability from an engineering perspective. Well Monitoring vs. Observability, which one is the accurate solution for your IT environment. Discover with ODYA team!

What Is Monitoring?
Monitoring is the process of tracking predefined metrics — such as CPU usage, memory consumption, disk I/O, response times, and error rates — to detect anomalies early and maintain system health.
Monitoring tools (e.g., SolarWinds, Zabbix, Prometheus, Grafana) typically:
- Collect time-series performance data
- Trigger alerts when thresholds are exceeded
- Gather and correlate logs
- Visualize system health via dashboards
Monitoring is essential for operational awareness, but it only tells you what happened, not why it happened.
What Is Observability?
Observability is the capability to understand a system’s internal state based on its external outputs. It combines metrics, logs, and traces to establish context and causality within complex distributed systems.
Key pillars of Observability:
1) Metrics : Quantitative measurements of performance and resource usage
2) Logs : Detailed records of discrete events
3) Traces : End-to-end tracking of requests across multiple services
Modern Observability platforms (e.g., OpenTelemetry, Datadog, New Relic, SolarWinds Observability) ingest these signals and perform time-series analysis, correlation, and Root Cause Analysis (RCA).
Unlike Monitoring, Observability can reveal unknown unknowns — insights into behaviors or issues you didn’t explicitly anticipate.
Differences Between Monitoring and Observability
| Feature | Monitoring | Observability |
|---|---|---|
| Goal: | Detect failures | Understand root cause |
| Approach: | Reactive | Proactive |
| Data Source: | Predefined metrics | Metrics, logs, traces, dependencies |
| Focus: | Thresholds, alerts | Context, correlation, causality |
| Scope: | Narrow (single component) | Broad (entire topology) |
| Example: | CPU usage > 90% alert | Which microservice caused API latency? |
Similarities
- Both aim to ensure system uptime, performance, and reliability
- Both rely on telemetry data (metrics, logs, traces)
- Both are integral to DevOps and SRE workflows
- Both drive faster incident response and MTTR reduction
Monitoring vs. Observability: Which One Is Right for You?
That depends on your infrastructure:
- If you’re running a monolithic or static system, traditional Monitoring might be enough.
- If you manage a microservices-based or cloud-native architecture, you need Observability to make sense of distributed dependencies.
- In practice, the best approach is hybrid:
Monitoring gives you the signal that something’s wrong; Observability explains why it happened.
The Role of AI in Monitoring and Observability
Artificial Intelligence (AI) and Machine Learning (ML) have become key enablers of modern Observability.
AI-powered platforms can:
- Detect anomalies automatically
- Correlate related alerts to reduce noise
- Perform Root Cause Analysis (RCA)
- Predict failures before they occur
- Trigger auto-remediation workflows
Solutions like ODYA Automated NOC leverage AI-driven event management to make Monitoring and Observability autonomous and adaptive.
Do Monitoring and Observability Work Together?
Absolutely. Observability is the natural evolution of Monitoring — not its replacement, but its complement.
When combined:
- Monitoring provides real-time visibility.
- Observability provides actionable understanding.
- AI connects both with predictive intelligence.
Together, they transform IT operations from reactive to proactive and self-healing.
Conclusion
- Monitoring answers “What is happening?”
- Observability explains “Why is it happening?”
- AI predicts “What will happen next?”
In modern infrastructures, combining these three layers increases service reliability, reduces MTTR, and delivers smarter operations.

