Database Monitoring

From Database Monitoring to Database Mastery

This white paper provides a step-by-step guide on how to go beyond basic monitoring and gain full control over your database with the updated SolarWinds Database Monitoring solution.

Fill out the form to request the white paper.

    Why SolarWinds

    Fortune 500
    Trust

    300.000+
    Global User

    24/7 Technical
    Support

    Over 25 Years of
    Experience

    ODYA Technology

    Don’t Just Watch. Understand, Prevent, Take Control!

    Identify potential issues early, diagnose them quickly, and optimize them permanently!

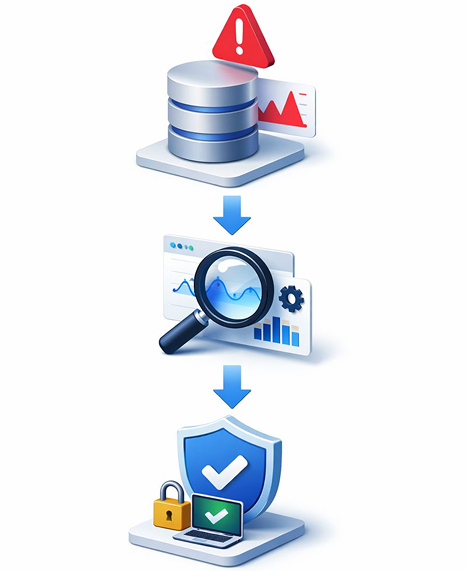
    While Database Monitoring is based on the “notify me when something breaks” approach, Observability can also answer the questions “Why did it break? How can it be fixed? How can it be prevented in advance?”

    With Database Observability, monitoring processes have become much more intelligent, proactive, and comprehensive!

    ODYA Technology

    Database Monitoring, Database Observability

    Database Observability, veritabanı performansını görünür, yönetilebilir ve sürdürülebilir hale getirir.

    Real Time Full Visibility

    Monitor database resource usage, query performance, and system bottlenecks in real time. Use early warnings to quickly identify the root causes of slow queries and performance drops.

    Smart Root Cause Analysis

    CPU/memory kullanımı, I/O bekleme süreleri ve hatalı sorgu yapılarındaki sorunları dakikalar içinde teşhis ederek aksiyon alın.

    Continuous Optimization

    Sürekli optimizasyon aklaşımıyla, sorgu maliyetlerini analiz edin, en yoğun yük oluşturan işlemleri belirleyin ve veritabanı performansını sistem genelinde artırarak maliyetleri düşürün.

    On-prem, Cloud
    and Hybrid

    Cloud ve Hybrid ortamlarda tüm veritabanı varlıklarınızı merkezi bir panelden izleyin; birleşik gözlemlenebilirlik ile güvenli ve kesintisiz operasyon sağlayın.
    Growing Problems Caused by Slowing Database Performance

    Delayed Intervention, Increased Losses

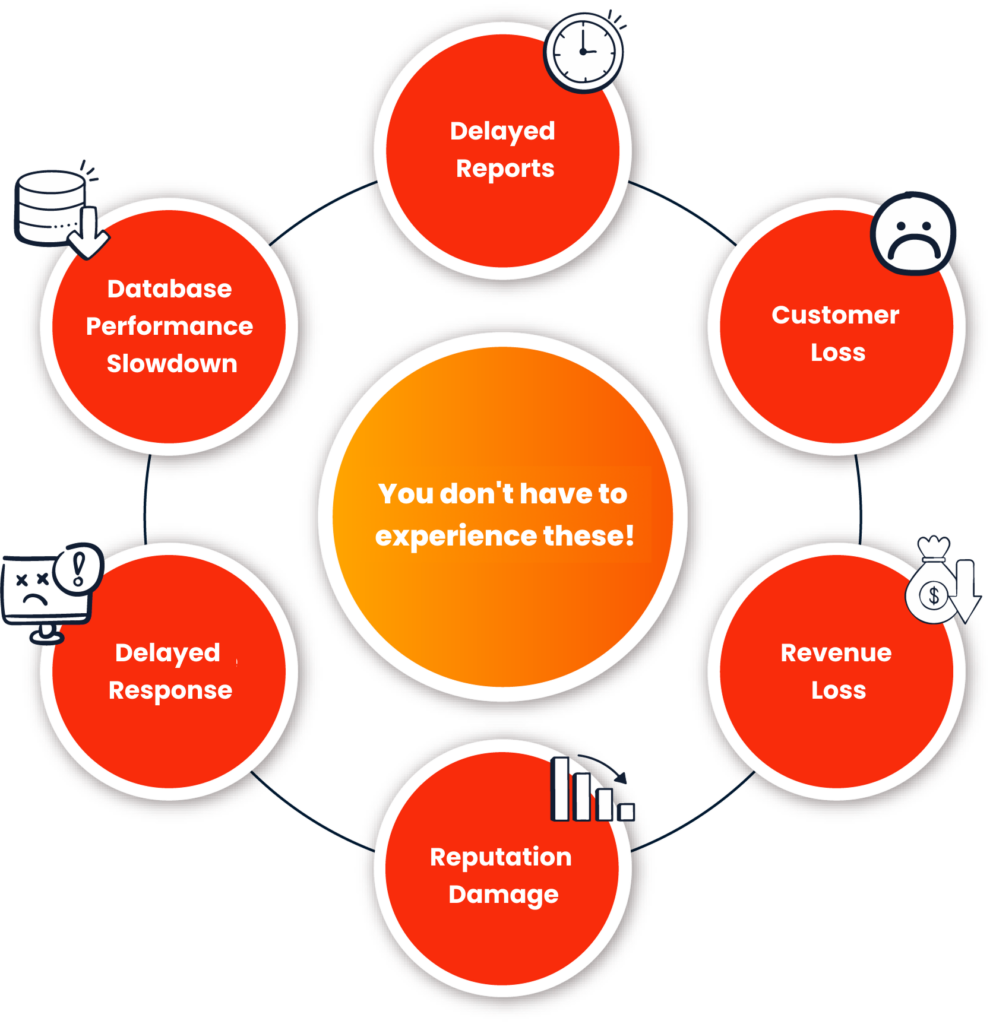
    One morning, your systems are responding a little slower than usual. At first, it goes unnoticed. Then critical reports are delayed, users exit the application, and sales drop…

    Time is wasted while the technical team searches for the source of the problem; in the meantime, revenue, reputation, and customer satisfaction suffer.

    Performance issues create a domino effect. If not detected early, they escalate and turn into a crisis!

    That’s why it’s not just about performance monitoring—predicting issues, responding quickly, and optimizing are critical.

    Database Monitoring

    SolarWinds Database Monitoring Solutions
    Which One Is Right for You?

    Every organization has a different database architecture and different priorities. SolarWinds Database Monitoring solutions offer flexible options tailored to these differences.

    ODYA Technology

    Managed Services

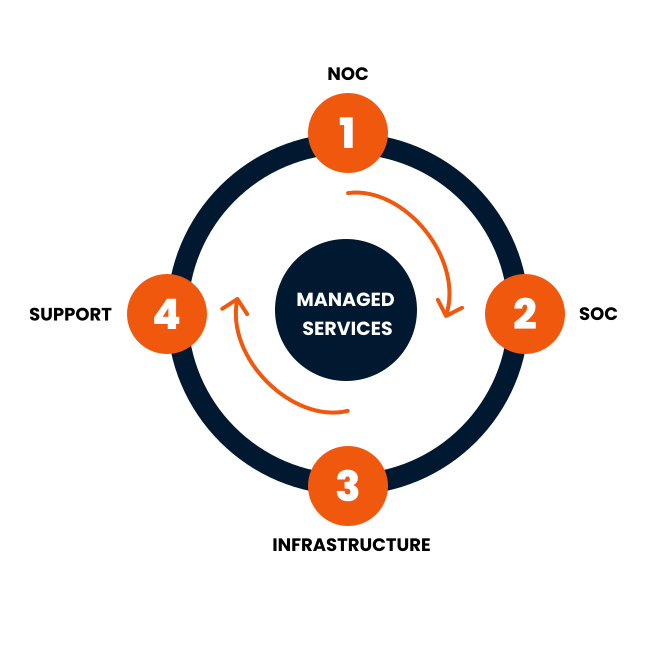
    Managed Services is the process of having your IT infrastructure monitored, maintained, managed, and reported on by an expert service provider. All your infrastructure components—such as servers, networks, and databases—are monitored, maintained, managed, and reported on 24/7. This service enables businesses to use their internal resources more efficiently and provides you with expert support in technology management. ODYA Technology monitors, maintains, manages, and reports on your IT infrastructure, ensuring uninterrupted and secure operations.

    Secure your infrastructure with Managed Services and increase the efficiency of your business processes.

    F.A.Q

    Frequently Asked Questions

    A database is a structure in which data is stored, accessed, and managed in an organized manner. From enterprise applications to websites, and from production systems to financial processes, millions of data points are stored in relational (SQL) or non-relational (NoSQL) databases across all fields.

    Relational Databases (SQL): Systems such as MySQL, PostgreSQL, Oracle, and Microsoft SQL Server stand out for their data integrity and consistency.

    Non-Relational Databases (NoSQL): Systems such as MongoDB, Cassandra, and Redis are preferred for big data, flexible configurations, and high speed.

    Databases are the heart of a system. Parameters such as resource consumption, query time, connection management, and index structure directly affect the system’s overall performance. A database that is not managed efficiently leads to slow applications, user complaints, rising infrastructure costs, and unexpected system outages.

    SolarWinds Database Observability: Metrics such as CPU and memory usage, query response times, and disk I/O performance are monitored in real time. Sudden spikes, anomalies in resource consumption, or stuck queries are detected early, and root cause analysis of issues is performed. This prevents the system from reaching a bottleneck and ensures there are no service outages.

    Database performance is the primary determinant of application response times. Slow queries or stalled transactions can directly cause application delays or crashes. With Database Observability, you can clearly see which queries are consuming how many resources and which transactions are slowing down the system.

    Database Performance Metrics are technical data points tracked to measure how fast, efficiently, and reliably a database operates. These metrics provide answers to questions such as how the database uses system resources, how many transactions it processes, and how long it takes to complete those transactions. Query Response Time, Throughput, CPU & Memory Usage, Disk I/O, Connection Count, Lock Wait Time / Deadlocks, Cache Hit Ratio, and Replication Lag are the most common database performance metrics.

    Database Monitoring is limited to simply measuring and displaying these metrics. Database Observability, on the other hand, provides deeper insights by correlating these metrics with meaningful context. Monitoring tells you, “Query response time is high.” Observability, on the other hand, shows you which application, which user, which table, at what time, and under what workload conditions the query originated, and helps you understand why it slowed down.


    In modern systems, Database Observability is a critical tool not only for database administrators (DBAs) but also for application teams, infrastructure specialists, and SRE teams.

    Yes! To take a closer look at the solution and see how it can improve your database management, you can request a demo by filling out the form at the top of the page.

    ODYA Technology

    Let’s Talk With
    Our Experts

    From IT to the field, discover the end-to-end monitoring and seamless control solutions you need—straight from our team!

      İletişim, ODYA Teknoloj, Contact us, ODYA Contact

      +90 216 577 5320

      info@odya.com.tr

      Headquarters

      Barbaros Mah. Begonya Sok. No: 3 NİDA Kule Kuzey Kat: 12 Ofis:133, 34746 Ataşehir/İstanbul

      R&D Center

      BİRUNİ Teknopark – Kazlıçeşme Mah. 245.Sok. No:5 Zeytinburnu/İstanbul

        Contact Us
        Contact Us