Did you know Instana's top features?
Observability is the ability to measure the outputs of complex processes of a system by examining them. A system is considered “observable” if the current state can only be predicted using information from outputs, i.e. sensor data.
Instana provides this through a single platform. It provides observability to corporate businesses to manage the performance of complex and distributed applications regardless of the environment; Thus, DevOps teams can accelerate their CI/CD processes.
The benefits that Instana provides in enterprise observability can be listed as follows:
1) Monitoring mobile apps
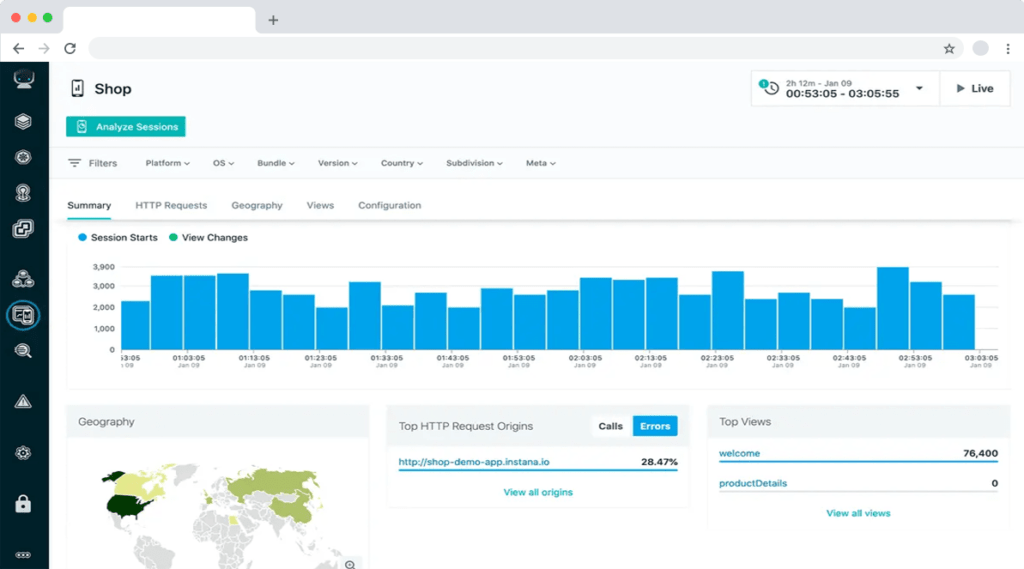
Instana supports mobile app tracking by analyzing actual URL request times, providing detailed insights into users’ app experience and deep visibility into app requests.
2) Monitoring websites
Instana supports website monitoring by analyzing actual browser request times and route times. It provides detailed insights into users’ web browsing experience and deep visibility into application request paths.
3) Monitoring applications, services and endpoints
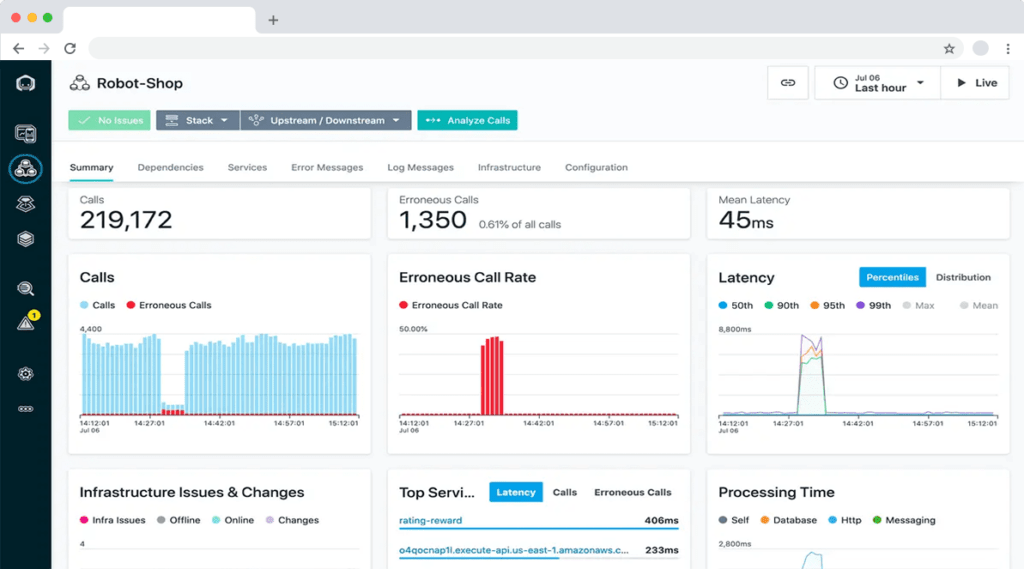
Instana delivers next-generation Application Performance Management (APM) with application hierarchy of services, endpoints, and application perspectives across them. The main goal is to simplify the monitoring of the service quality of your business.
4) Serverless monitoring
Instana has native tracking features specific to Function-as-a-Service or Container-as-a-Service platforms.
5) Infrastructure-as-a-Service monitoring
Each cloud provider offers a directly managed service. Instana host agent can be set up in certain ways to monitor such services.
6) Kubernetes monitoring
Instana can help you access detailed Kubernetes information, analyze requests, connect Kubernetes services and logical services, use built-in or customized rules for entity alerts, and monitor workloads distributed across the service mesh.
7) Cloud Foundry and VMware Tanzu monitoring
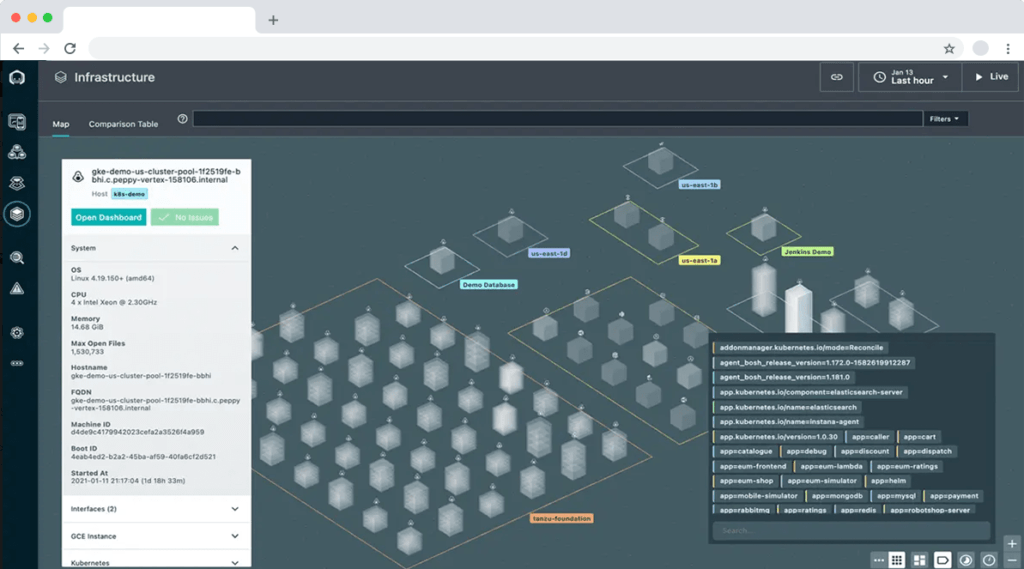
Servers and containers in Cloud Foundry or VMware Tanzu infrastructure are automatically discovered and placed on the infrastructure map. You can easily filter for all entities.
8) vSphere monitoring
Instana lets you monitor metrics and configuration data on vSphere.
9) Infrastructure monitoring
Instana ensures infrastructure monitoring and representation at all times. All issues and changes detected in the infrastructure are constantly associated with issues and events occurring at the application and end-user level. In this way, users can have a comprehensive knowledge of all the layers that provide the application.
10) Profile operations
Instana AutoProfile™ creates an automated and continuous production profile that lets you continuously analyze code-level performance in production without negatively impacting production practices.
11) Managing events and alarms
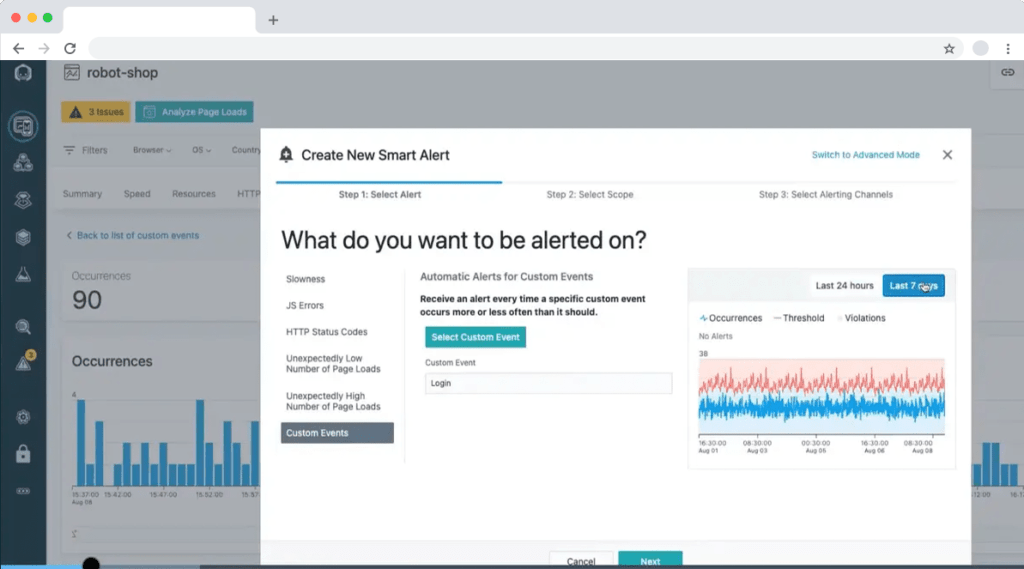
Instana can be used to manage issues and events, define custom events, configure and manage alarms, set up alarm channels, schedule maintenance windows, and configure custom payloads in areas.
12) Creating custom dashboards
In addition to fixed dashboards in the Instana UI for common use cases, Instana supports custom dashboards to better meet users’ needs.
13) Service level objectives
Instana allows users to create and manage your Service Level Objectives (SLOs), which are necessary to analyze quality of service (QoS) and reliability goals in tangible, measurable, objective terms.
14) Filtering with dynamic focus
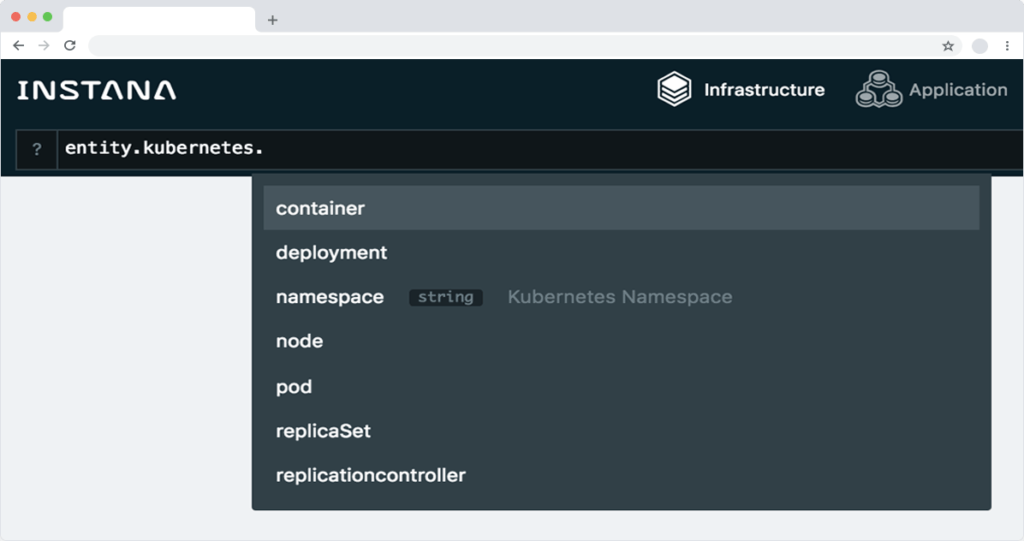
Instana provides Dynamic Focus, a powerful search and filtering functionality that can search all data contexts simultaneously.
15) Leveraging dynamic graph
Instana, Host, OS, JVM, Cassandra Node, MySQL etc. Provides Dynamic Graph, a model of your application that understands all physical and logical dependencies of components. The graph also includes logical components such as beacons, applications, services, clusters, and tablespace.
16) Proactive monitoring
Instana can be used to perform proactive monitoring of your websites and apps through Synthetic Monitoring. It allows you to create artificial tests that mimic API requests and actions taken by your users to get early warning of problems with your websites or applications.
You can contact us to get information about Instana!


