🔍 Full-Stack Visibility: Is End-to-End Monitoring Possible?
Today’s digital infrastructures are no longer limited to a single layer. Applications run on container-based microservice architectures, databases are hosted on cloud platforms, and users access systems from all around the world on different devices and network conditions. In such a complex environment, monitoring only metrics like CPU, RAM, or network traffic is not sufficient. IT teams now need to answer not only “what happened?” but also “why did it happen and who is affected?” This is where SolarWinds Observability comes into play, providing organizations with end-to-end visibility (Full-Stack Visibility).
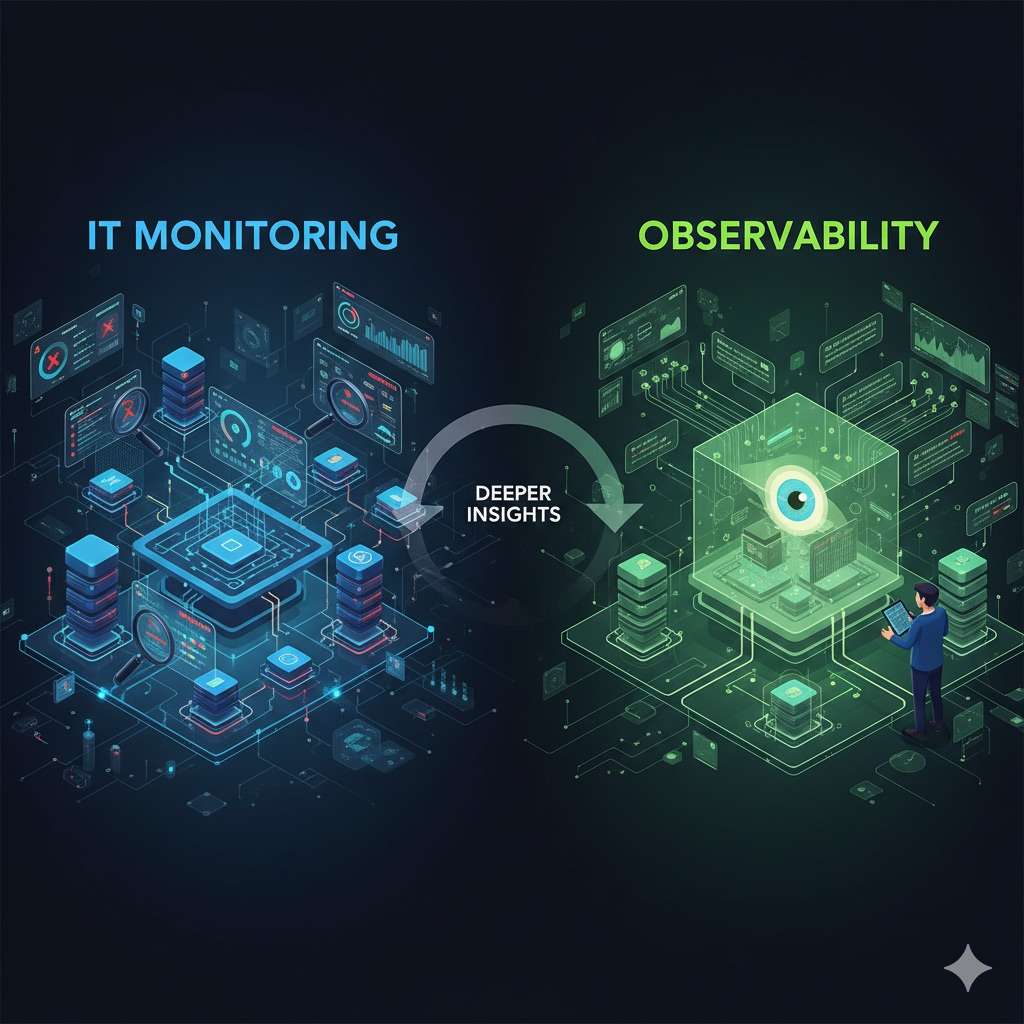
Why Do Blind Spots Occur in Traditional Monitoring?
Traditional monitoring tools usually focus on a single layer:
- Network monitoring tools can see network traffic but cannot detect application errors.
- APM (Application Performance Monitoring) tools track application behavior but cannot detect CPU throttling on the physical server.
- Database monitoring tools or Database Performance Analyzer can show query performance, but cannot explain why a container restarted.
The result: issue resolution takes longer, teams hunt for data across multiple dashboards, and root cause analysis can take hours.
What Makes SolarWinds Observability Different?
SolarWinds Observability (SWO) unifies all these layers into a single data model. This model collects data from three main telemetry sources:
Metrics: CPU, memory, I/O, response time, throughput, and more.
Logs: System, application, and service logs.
Traces: Request chains between microservices.
By combining these three sources contextually, SWO answers the question: “Which event started in which layer, and how did it propagate?”
Full-Stack Visibility Layers
SolarWinds Observability provides end-to-end visibility across four key layers:
Network Layer
- Monitors packet loss, latency, interface utilization, and SNMP data.
- With strong integration from Network Performance Monitor (NPM), it analyzes which network segments are impacting application traffic.
Application Layer
- Tracks in-code metrics, transaction durations, and error rates.
- Distributed tracing monitors delays and error points between microservices.
- Real User Monitoring (RUM) provides real-time insights into the end-user experience.
- Monitor user experience to minimize customer churn!
Infrastructure Layer
- Covers servers, virtualization platforms, containers, and Kubernetes clusters.
- For example, Kubernetes POD health, node capacity, and autoscaling behavior can all be viewed on a single panel.
Database Layer
- Direct integration with AWS, Azure, or GCP resources.
- Monitors EC2 instance metrics, RDS performance trends, and S3 latency.
- SQL and NoSQL database query performance is directly correlated through Database Performance Analyzer (DPA).
See How Layers Interconnect with Full-Stack Visibility
Full-Stack Visibility is not just about seeing all layers—it’s about understanding the relationships between them. SolarWinds Observability establishes this connection through automatic dependency mapping:
- A slowdown in a web application can be correlated with simultaneously increasing database query times and CPU spikes.
- These relationships are automatically discovered by the platform without any manual configuration.
- The result: root cause analysis can be performed within seconds.
AI/ML-Powered Anomaly Detection
Full-Stack Visibility becomes truly powerful when meaningful signals are separated from noise. SolarWinds Observability’s machine learning capabilities learn the normal behavior of each entity and automatically flag deviations. This enables system administrators to detect anomalies in real time without the need for manually configured thresholds.
Why Full-Stack Observability Matters
Monitoring without full-stack observability only tells you “what happened.” SolarWinds Observability goes further, answering “why did it happen, where did it start, and who is affected?” In modern IT environments, observability is far more than collecting metrics—it is about contextual insight and relationship management.
Unlocking the Full Potential with Expert Teams
While SolarWinds Observability is a powerful tool on its own, its true potential is realized when used by teams with deep expertise across Network, Infrastructure, Database, Application, and Security layers. For this reason, partnering with ODYA Teknoloji can make a significant difference in your monitoring projects. With our expert team, you can accelerate your processes, gain deeper visibility, and make your infrastructure more secure and manageable—all while maximizing performance and efficiency across your SolarWinds ecosystem.