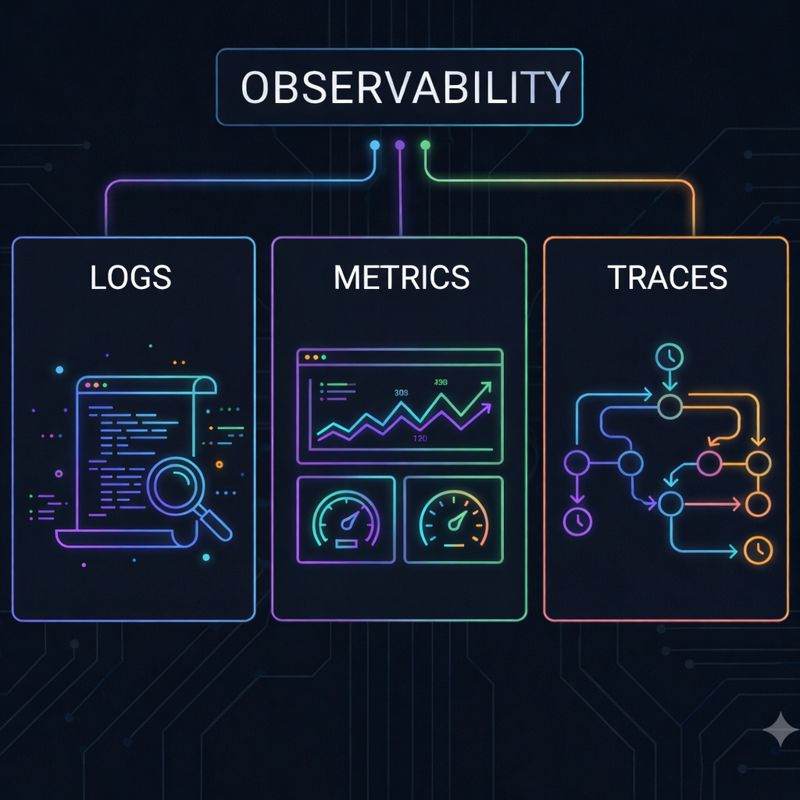
What Do Logs, Traces, Metrics Help You See?
In today’s world of complex, cloud-native environments and microservices, simply knowing whether a system is “up” or “down” is no longer enough. When an incident occurs, we need to answer deeper questions: “Why did it happen?”, “Where did it originate?”, and “Who was affected?” This is where Observability —a cornerstone of modern software reliability—comes into play. Observability is a measure of how well you can understand the internal state of your system by looking at its external outputs. This structure is built upon what we call the “Three Pillars”: Logs, Metrics, Traces. Let’s take a closer look at what these concepts mean and how they work in harmony.
Logs: The Historical Record of Events
Logs are time-stamped, text-based records of discrete events that occur within your system. They are the most fundamental form of observability data. Whether a user logs in, a database error occurs, or a payment is processed, a “log line” is generated.
- Strength: They provide granular detail. When you need to know “exactly what happened” during a crash, logs are your primary source.
- Weakness: They produce massive amounts of data. Searching through millions of lines can be difficult, and storage costs can escalate quickly.
- Types: They can be unstructured (plain text) or structured (like JSON), which are much easier for machines to parse and analyze.
Metrics: The Heartbeat of the System
Metrics are numerical representations of data measured over intervals of time. They answer questions like “How busy is the system?”, “What is the memory usage?”, or “How many requests are we receiving per second?”
- Strength: They are predictable and consume very little storage. Metrics are perfect for building dashboards and setting up real-time alerts. They allow you to spot trends instantly.
- Weakness: They lack context. A metric can tell you that CPU usage spiked to 99%, but it won’t tell you whichspecific process or user request caused it.
- Examples: CPU utilization, error rates, and request latency.
Traces: The Journey of a Request
In a microservices architecture, a single user request might travel through dozens of different services before completion. Tracing allows you to follow that journey from end to end. Each stop along the way is called a “span,” and the collection of these spans forms a “trace.”
- Strength: They are unparalleled for identifying bottlenecks in distributed systems. Traces show you exactly where a request slowed down and which service is responsible.
- Weakness: Implementing and managing tracing can be complex, especially in legacy environments.
Why Do You Need All Three? (The Art of Correlation)
These three data types are not alternatives to one another; they are complementary. During an incident, a typical troubleshooting workflow looks like this:
Metric: An alert triggers. “Error rate has exceeded 5%!” (You know something is wrong).
Trace: You pinpoint where the failure is happening. “The delay is coming from the payment service’s response to the database.” (You know where it is wrong).
Log: You filter the logs using the specific Trace ID. “Error: Connection timeout with the Credit Card API.” (You know why it is wrong).