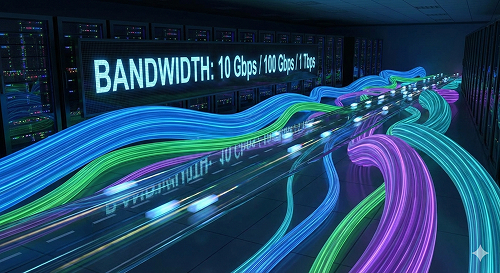
What Is Bandwidth and Why Is Bandwidth Monitoring Critical?
We have a bandwidth issue” is one of the most frequently heard statements within IT teams today. However, more often than not, this statement represents an incorrect reflex rather than an accurate diagnosis. In modern IT architectures, bandwidth monitoring can no longer be limited to network link utilization alone, as bandwidth has evolved into an end-to-end capacity indicator across multiple layers.
A significant portion of real-world performance problems becomes prolonged, complicated, and unnecessarily costly precisely because bandwidth is investigated at the wrong layer.
This article revisits the concept of bandwidth, explains why it must be evaluated across multiple layers, highlights the limitations of traditional bandwidth monitoring approaches, and outlines how ODYA Automated NOC addresses bandwidth-related challenges differently.
Rethinking the Concept of Bandwidth
At its most basic level, bandwidth refers to the maximum amount of data that can be transmitted or processed within a given period of time. Traditionally, this definition has been associated with network link capacities measured in Mbps or Gbps. While this interpretation is not technically incorrect, it is insufficient to explain modern systems.
Data does not merely travel from one point to another. It is generated by applications, processed by servers, stored within storage systems, and inspected by security layers. Therefore, bandwidth is not simply an answer to the question “How full is the link?”—it is an indicator of how effectively data flows end to end across the entire IT stack.
Understanding Bandwidth from a Layered Perspective
To evaluate bandwidth correctly, it must be considered not at a single point, but across the entire system.
Network Bandwidth
The network layer is only the visible surface of this chain. Utilization levels on WAN, LAN, MPLS, or internet links are usually the first metrics examined. However, a saturated network link does not always indicate that the network itself is the root cause—it only shows where the problem becomes visible.
- WAN / LAN link capacities
- MPLS, internet, and VPN connections
- Interface utilization
Challenge:
A network link may be fully utilized, but that does not necessarily mean the network is the real source of the problem.
Application Bandwidth
Applications are the primary consumers of bandwidth. In practice, actual bandwidth consumption often originates at the application layer. The volume of data generated by applications, the frequency of API calls, packet sizes, and real-time communication requirements directly increase pressure on the network. When network utilization appears low but application performance is poor, the issue is typically not network bandwidth, but the application’s data production and consumption model.
- API call volume
- Packet and payload size
- Real-time applications (VoIP, video, ERP, CRM)
Example:
If the network appears only 30% utilized while an application performs poorly, the issue is not bandwidth—it is how the application generates and consumes data.
Traditional monitoring tools can indicate that “there is traffic,” but they cannot explain why.
Infrastructure Bandwidth (Compute & System)
Bandwidth is not only about transporting data—it is also about processing it. Another critical layer is infrastructure. Server CPU, memory, and network interface capacity directly determine effective bandwidth. Even if a system has high theoretical network capacity, it cannot utilize it if processing resources are exhausted. In such cases, what appears to be a bandwidth issue is actually compute resource saturation.
- NIC capacity
- CPU and memory saturation
- OS- and kernel-level I/O limits
A server may have a 10 Gbps network interface, but if CPU usage is at 95%, effective bandwidth is significantly reduced.
Result:
The network is healthy, but the business is slow.
Storage Bandwidth
This layer is critical for backup, logging, and data-heavy applications. The storage layer is another integral part of the bandwidth equation. Disk throughput, IOPS limits, and SAN/NAS connectivity play a decisive role, especially in backup, logging, and data-intensive workloads. Slow data transfer over the network is often the result of a storage I/O bottleneck—yet traditional monitoring solutions fail to make this distinction.
- Disk throughput (MB/s)
- IOPS limits
- SAN / NAS connectivity
A very common scenario:
A ticket is opened for a “network bandwidth issue,” but the root cause is actually a storage I/O bottleneck.
Security Bandwidth
The security layer is frequently overlooked, yet it is a major bandwidth consumer. Finally, the security layer is often excluded from bandwidth discussions. However, firewalls, SSL inspection mechanisms, and intrusion prevention systems impose a significant data-processing load. When security devices reach their throughput limits, user experience can degrade even while the network and applications appear healthy.
- Firewall throughput limits
- SSL inspection capacity
- IPS / IDS processing load
Security device saturation can:
- Occur while network and applications remain stable
- Directly degrade user experience
Why Traditional Bandwidth Monitoring Approaches Fall Short for Bandwidth
Conventional approaches to bandwidth monitoring typically rely on isolated metrics. These solutions generate alarms when thresholds are exceeded, visualize utilization trends, and provide historical reports. However, this metric-centric approach introduces three fundamental problems.
- First, there is a lack of context. It is often unclear whether increased bandwidth usage actually impacts business processes.
- Second, there is no cross-layer correlation. A network issue is not evaluated together with application, infrastructure, or storage metrics.
- Third, alarm noise becomes unavoidable. Temporary bandwidth spikes that never turn into real problems still trigger alerts and consume operational attention.
As a result, bandwidth monitoring solutionscan answer the question “What is happening?” but fail to explain “Why is it happening?” and “What should be done?”
How ODYA Automated NOC Approaches Bandwidth Challenges
ODYA Automated NOC treats bandwidth not as a number to be observed, but as a risk domain that must be actively managed. The key difference lies in evaluating bandwidth issues across all layers—network, application, infrastructure, storage, and security—rather than in isolation.
This approach prevents misdiagnosis. When congestion is detected at the network layer, it becomes immediately clear whether the root cause is truly network-related or driven by application behavior or storage limitations. Multiple alerts originating from the same root cause are consolidated into a single, meaningful incident. As a result, NOC teams shift their focus from monitoring dashboards to actionable events.
Another critical distinction is ODYA Automated NOC’s ability to correlate bandwidth issues with business impact. It becomes clear which bandwidth problem affects which application, which user group, and which business process. This shared visibility creates a common language between technical teams and CIO-level decision-makers.
The automation layer completes this model. Bandwidth-related incidents are automatically routed to the appropriate teams, predefined actions are triggered when necessary, and the process is closed in a fully automated, closed-loop manner once the issue is resolved.
An End-to-End Capacity Indicator
Bandwidth is no longer a technical metric monitored solely by network teams. It is an end-to-end capacity indicator, spanning application, infrastructure, storage, and security layers. Interpreting bandwidth issues exclusively through a network lens often leads to incorrect diagnoses and delayed resolution.
This is precisely where ODYA Automated NOC differentiates itself:
It does not merely measure bandwidth—it makes bandwidth-driven business risks visible, manageable, and automated.