





Network Performance Monitoring (NPM): Everything IT Directors Need to Know
İçindekiler Network Performance Monitoring (NPM): Everything IT Directors Need to Know With the average cost of enterprise network downtime exceeding $300,000 per hour, a

Obtain a Service Tree structure by linking CIs together. Get to the root of the problem with the cause-and-effect relationship extracted via queries.
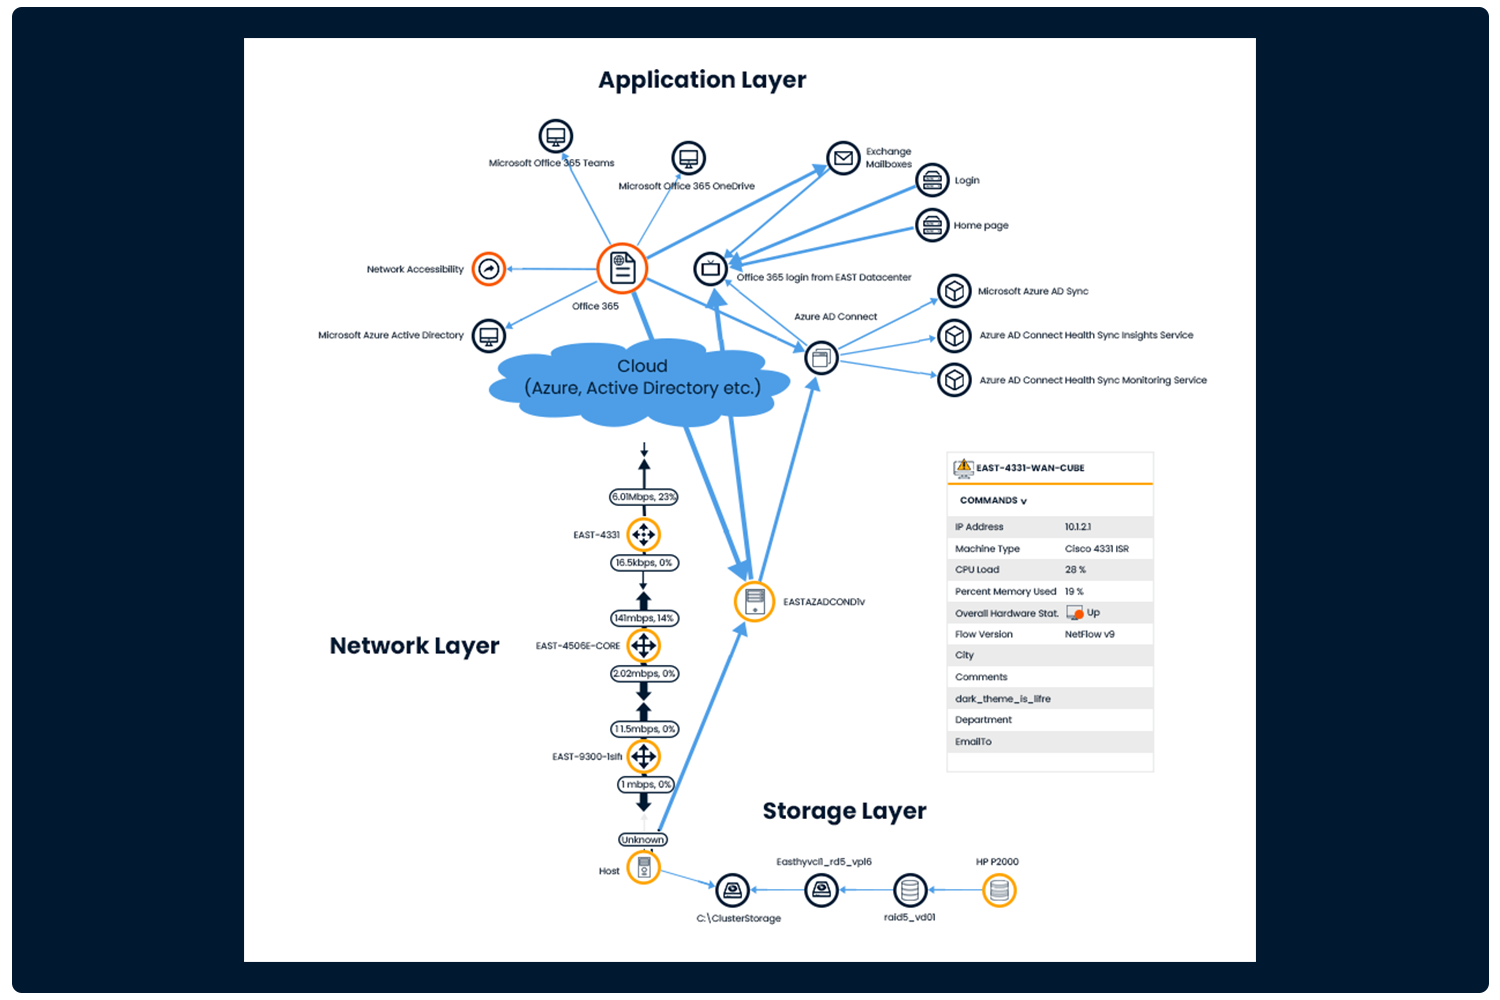
Is the physical hardware of the devices using the application functioning properly?
Which critical processes or services should I monitor for the application to run smoothly?
During application slowdowns, which layer (network, application, storage, virtualization, etc.) should I focus on for the latency?
Be informed in real-time about outages caused by third parties. Discover the root cause of application or service issues by performing code-level monitoring.
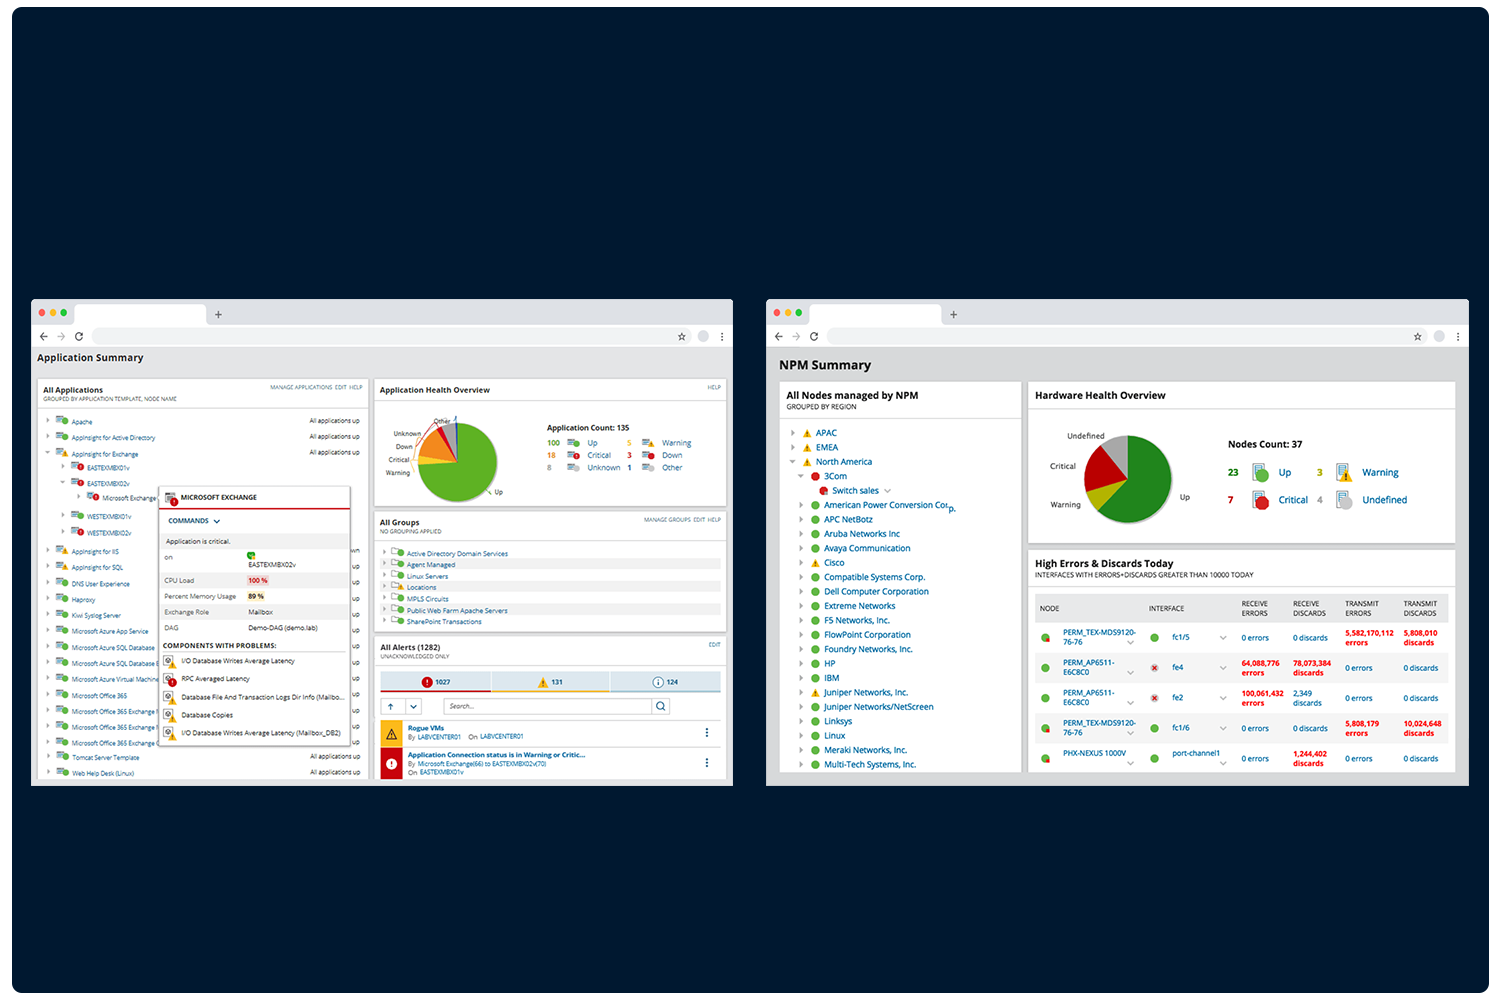
How do you view the source when there is a problem with your services?
Can the problem be monitored via a dashboard?
Are there dashboards tailored for executives during an incident?
Gather information about your application dependencies and visualize them in an easy-to-understand way. Have tables that list details about the different services your application uses and the connections between them.
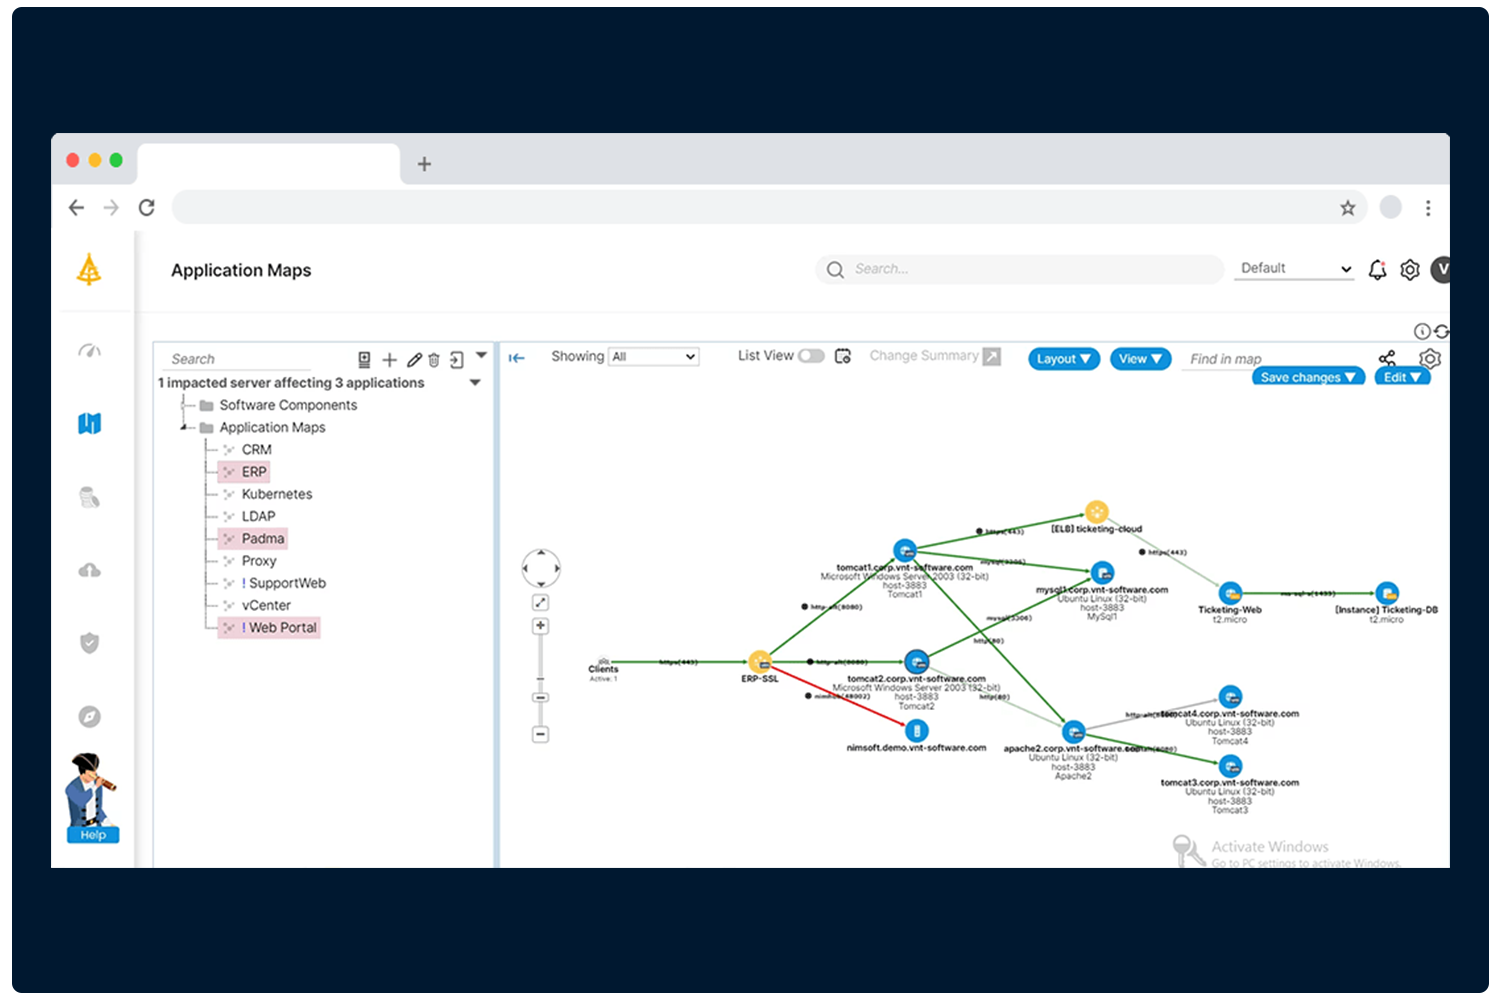
Do you know what other outages are triggered by the outages in your applications?
Do you have details about the connections between applications?
Can you accurately pinpoint performance bottlenecks?
İçindekiler Network Performance Monitoring (NPM): Everything IT Directors Need to Know With the average cost of enterprise network downtime exceeding $300,000 per hour, a
What Is NetFlow and How Does It Work? Why Understanding Network Traffic Matters? Network Monitoring · What is NetFlow? Monday morning, 09:00. “Internet is slow” ticket
NetFlow in 24/7 NOC Services: How Is Network Traffic Analyzed? NetFlow in 24/7 NOC Services Monday morning, 09:00. “Internet is slow” tickets are pouring in. Line utili

OHS Report: Answering the Question “What’s Happening on the Ground?” OHS Report & Video Analytics Occupational health and safety efforts typically rely on visual obse
What Is API Monitoring? Why Should APIs Be Monitored? API Monitoring API Monitoring is the continuous and automated measurement of the availability, performance, and correctness of

How to Follow the Configuration Management Procedure? Configuration Management Procedure How to Track Configuration Management Procedure? Closed-Loop Architecture with Asset Discov
The Painful Core of Enterprise Level Software Development: Choosing the Right Technology Enterprise Level Software Development In enterprise level software developments projects, t
Operating System Service Monitoring with Entuity: Architecture and Technical Details Infrastructure Monitoring OS Service Monitoring With Entuity: Architecture And Technical Detail
What Is Micro-Segmentation? Agentless Visibility and Segmentation Architecture with Faddom What is Microsegmentation? What is Microsegmentation? Agentless visibility and segmentati

+90 216 577 5320

info@odya.com.tr

Barbaros Mah. Begonya Sok. No: 3 NİDA Kule Kuzey Kat: 12 Ofis:133, 34746 Ataşehir/İstanbul
BİRUNİ Teknopark – Kazlıçeşme Mah. 245.Sok. No:5 Zeytinburnu/İstanbul