Your IT Infrastructure Never Sleeps: 24/7 Smart Monitoring
Your IT Infrastructure Never Sleeps: 24/7 Smart Monitoring! NOC & IT Operations & Smart Monitoring AI-supported automation, proactive alarm management, and L0–L2 techni
24/7 NOC Service ensures that an organization’s network, systems, and infrastructure are monitored, managed, and kept operational around the clock. With ODYA Automated NOC, you can perform proactive 24/7 monitoring in your IT environment, benefit from AI-powered incident resolution, and receive technical support at L0, L1, and L2 levels.
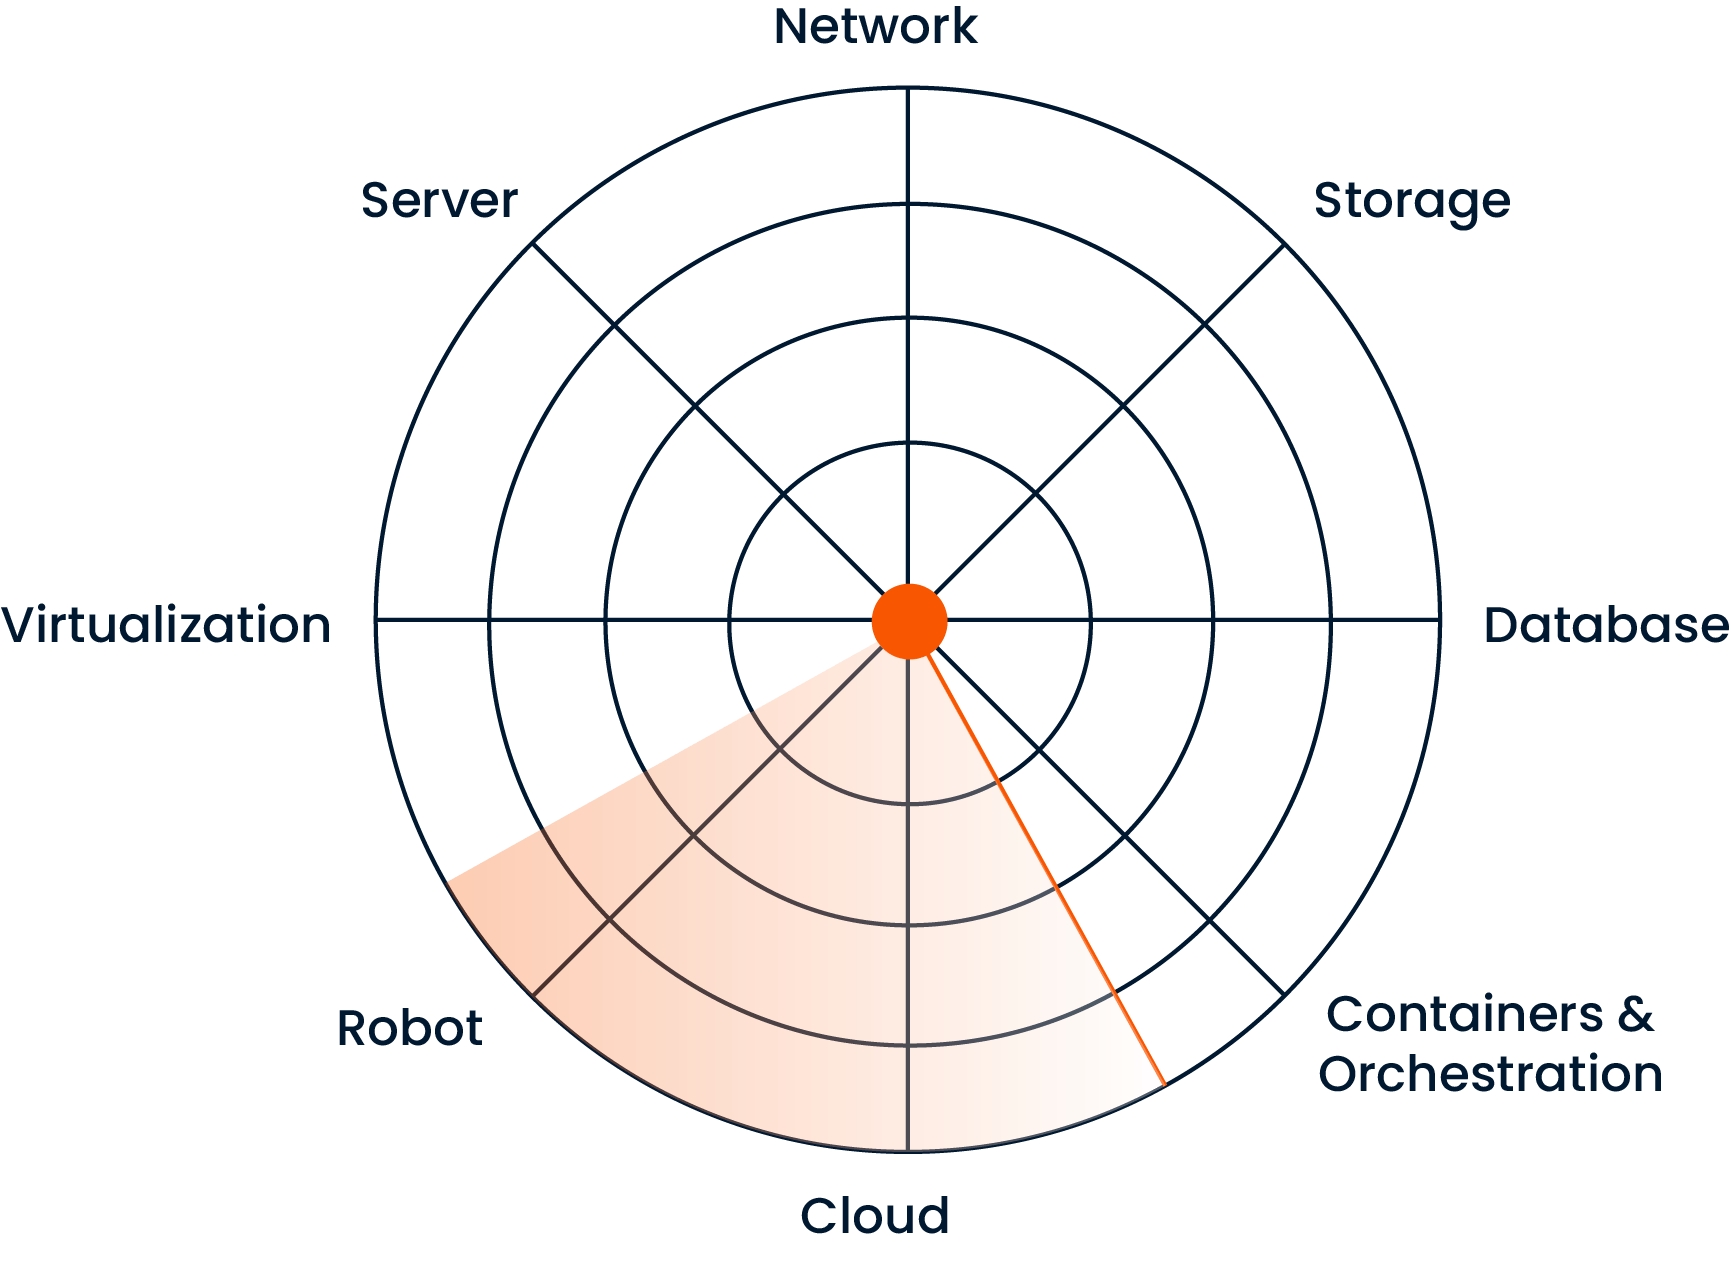
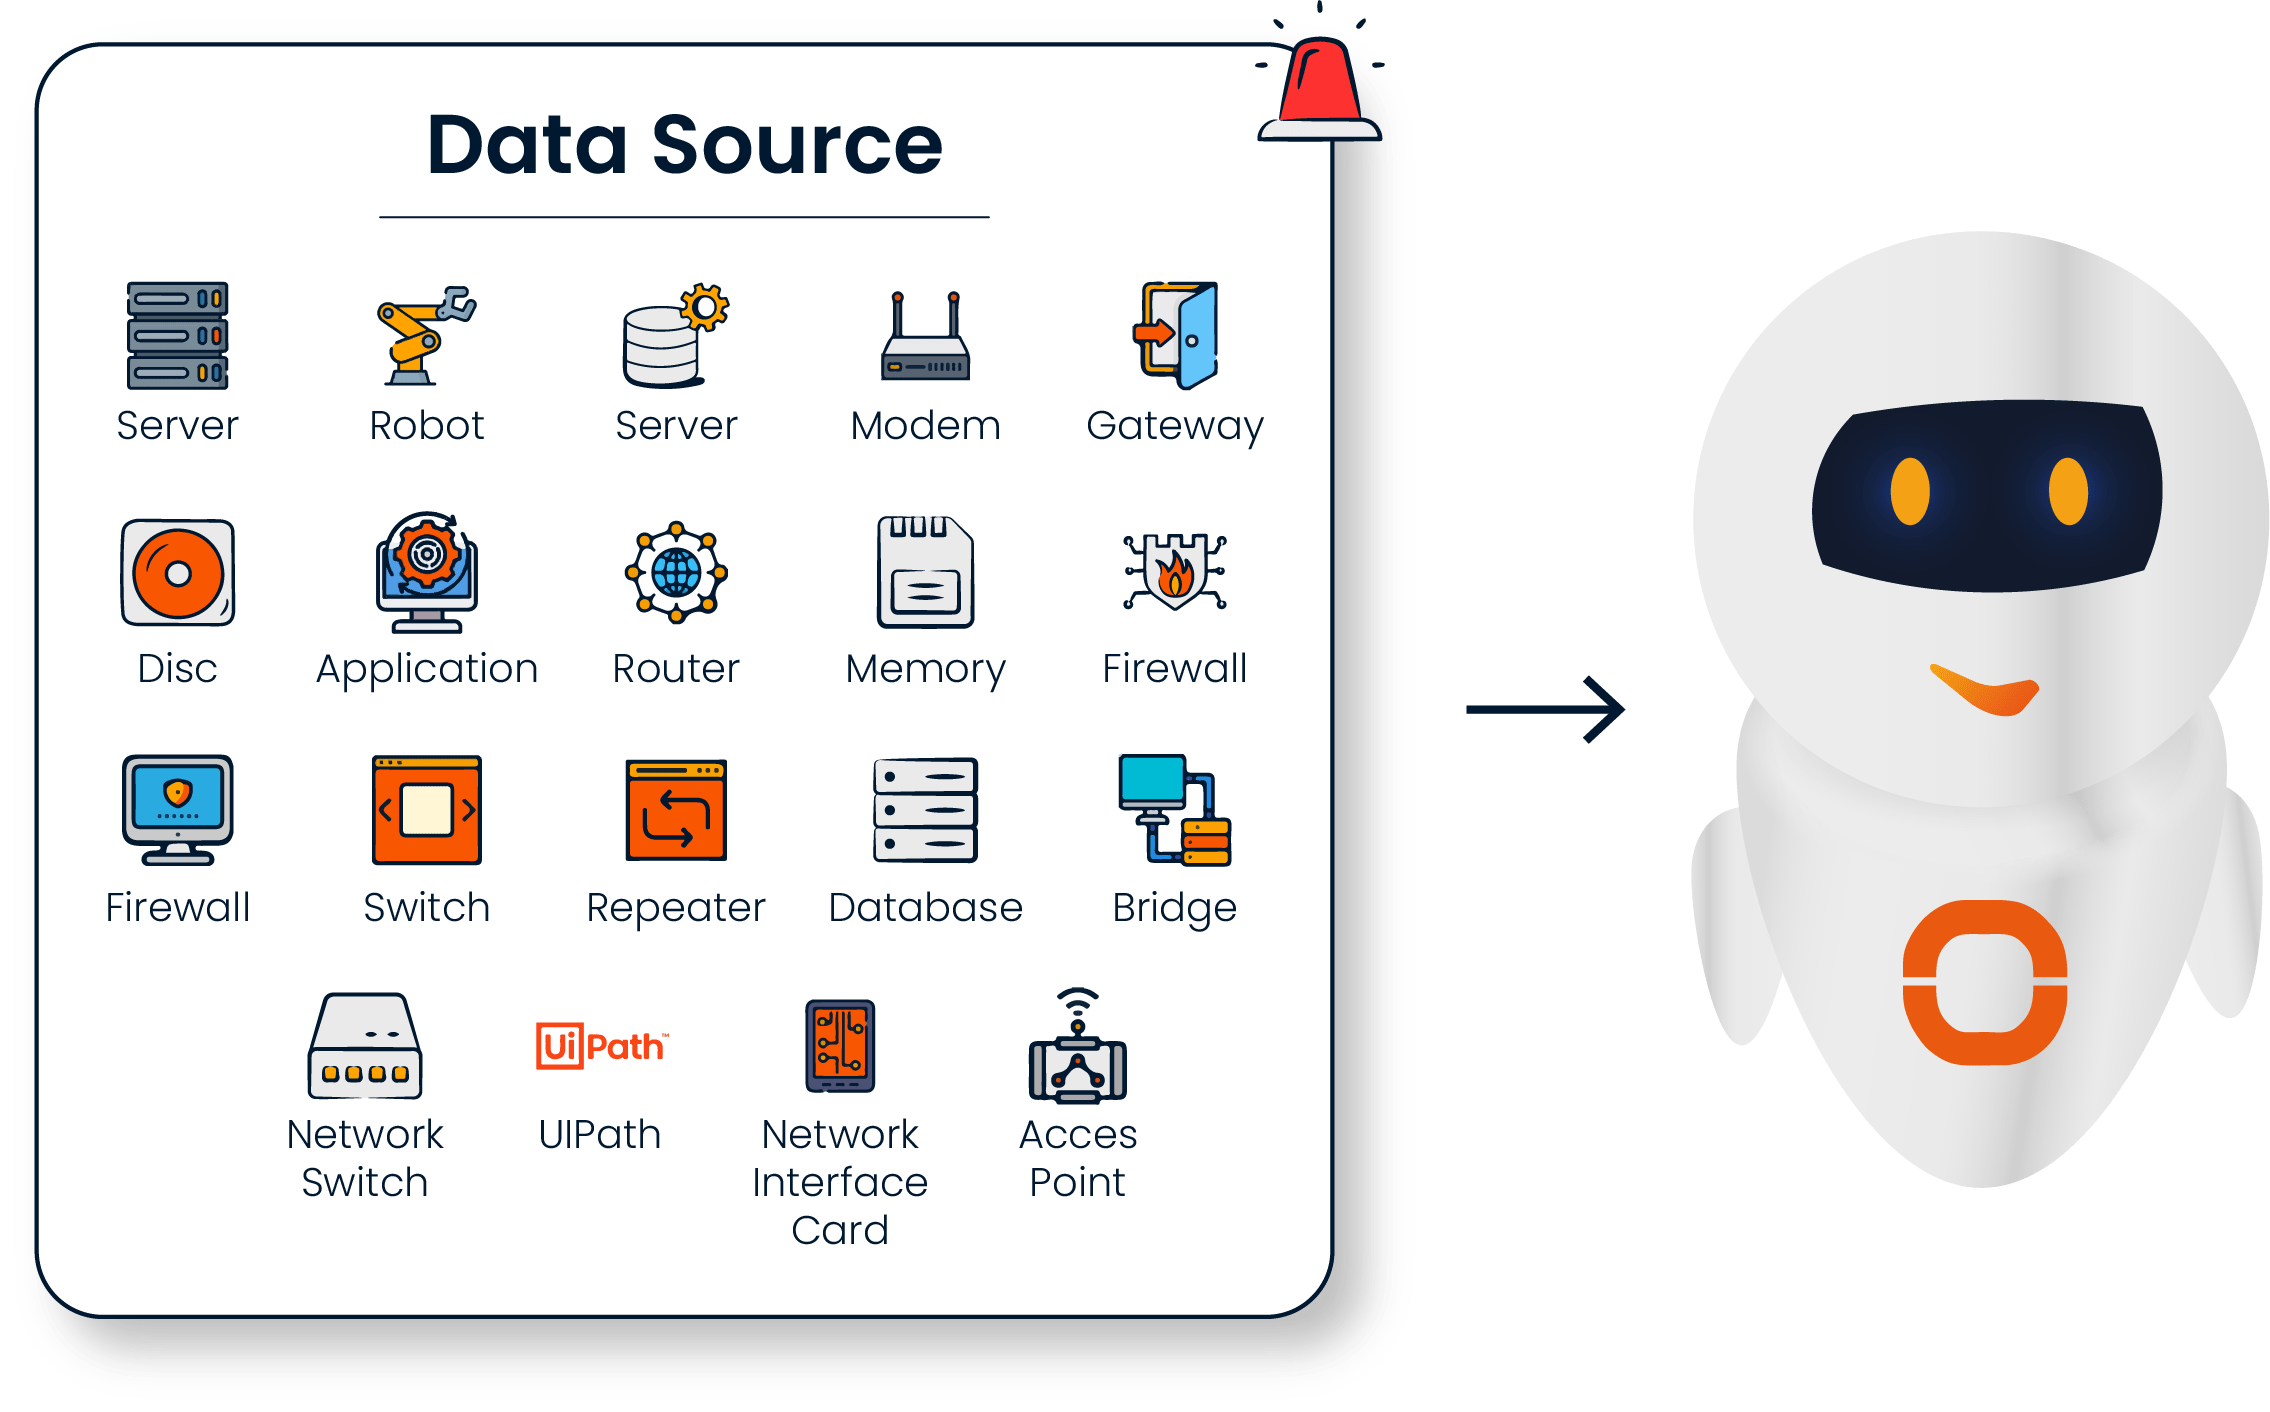
ODYA Automated NOC continuously monitors and analyzes all layers of your IT environment 24/7. It ensures uninterrupted tracking of components at every level of your infrastructure, enabling immediate intervention in case of potential issues.
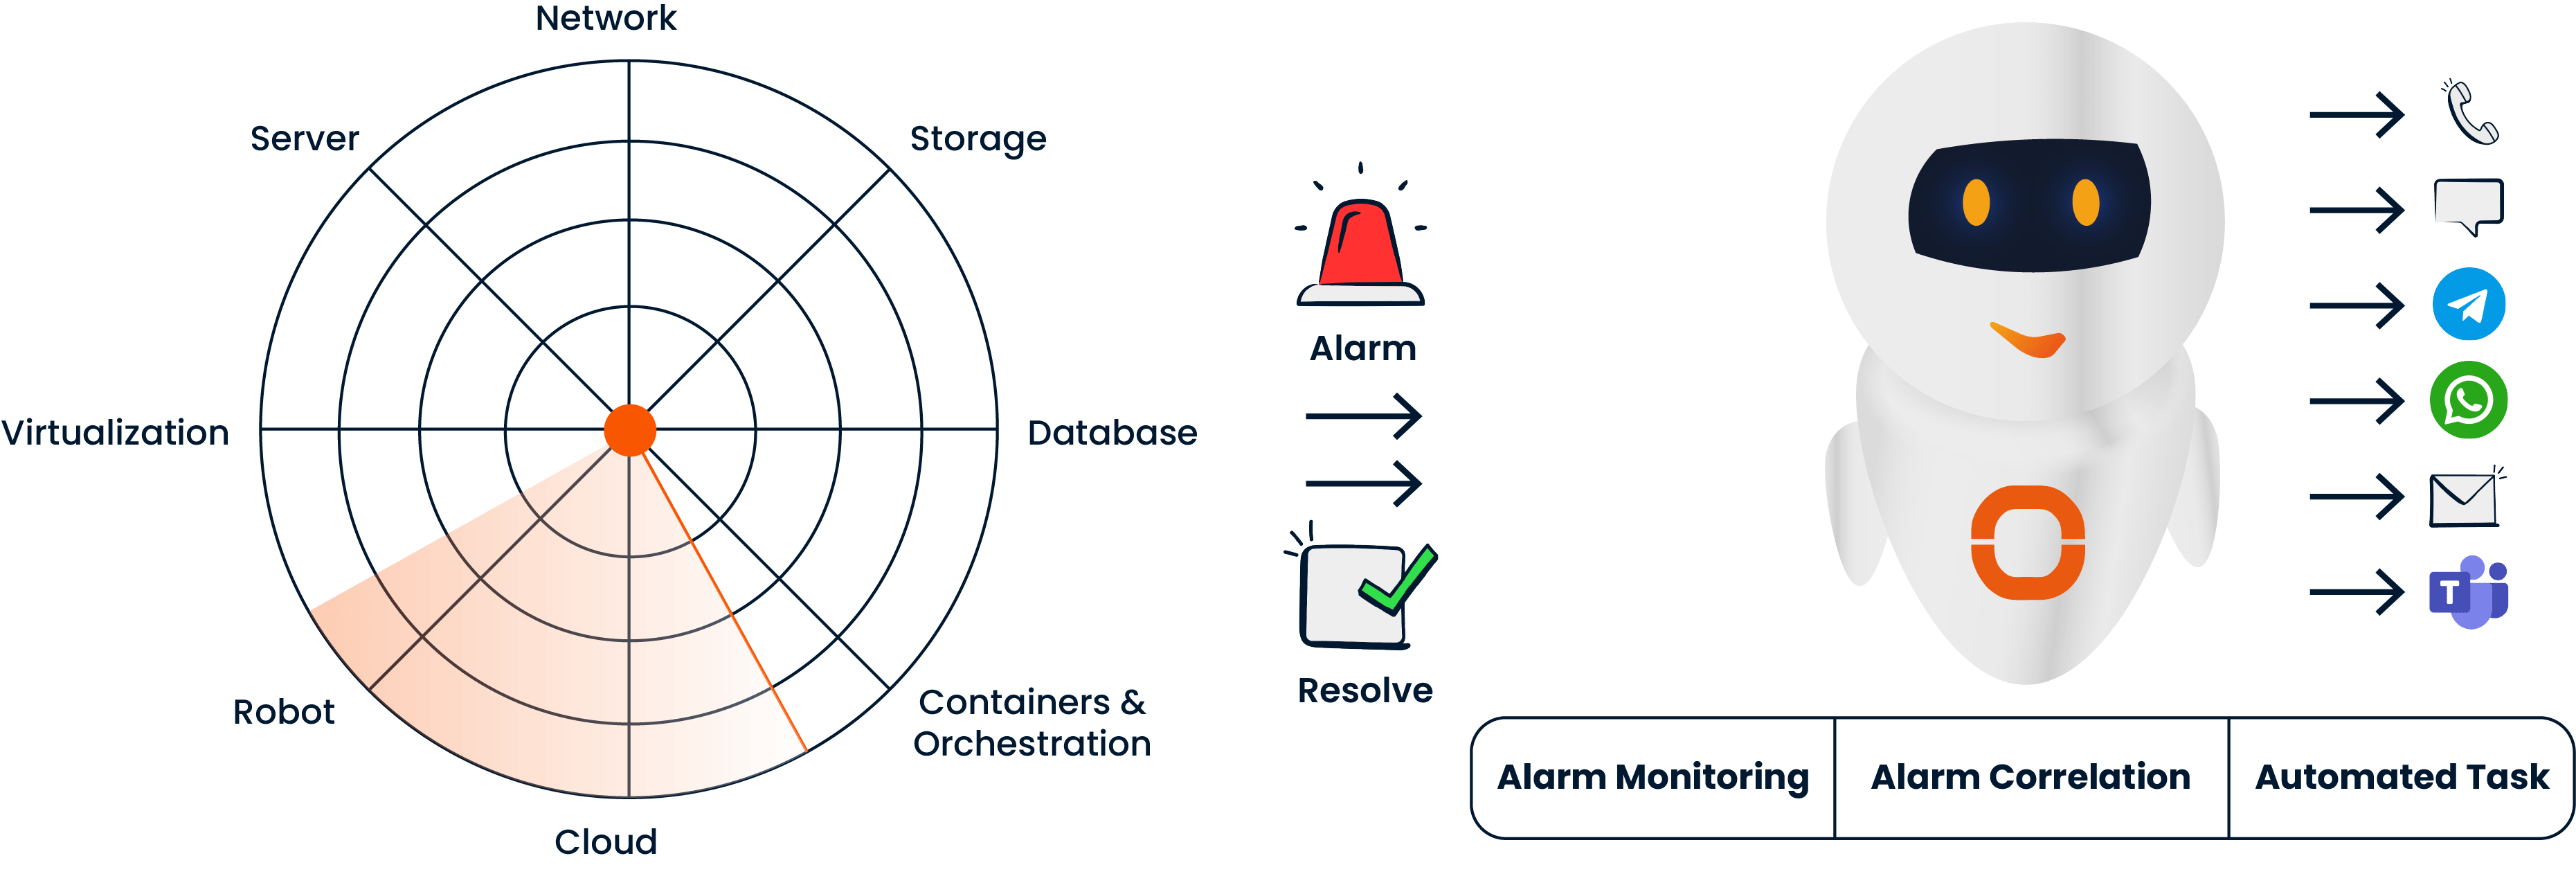
By automatically converting alerts from monitoring systems into actionable notifications, it eliminates the risk of missed incidents. When ODYA Automated NOC detects an event, it promptly notifies relevant teams via written alerts or call-based notifications through the platform.
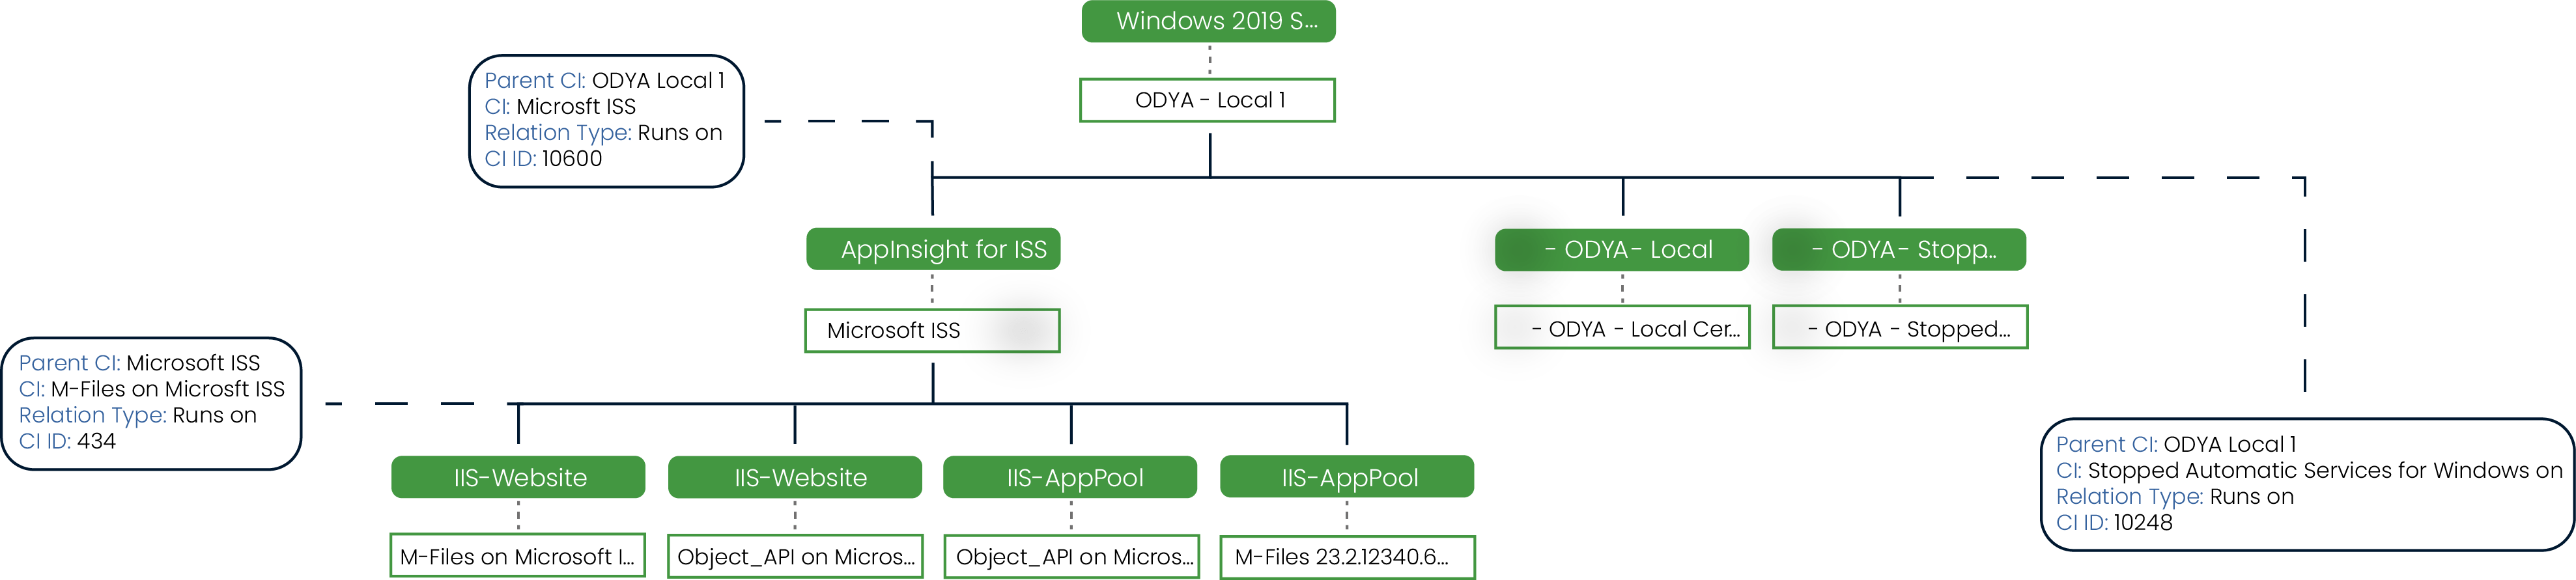
ODYA Automated NOC automatically discovers your IT assets, maps their interdependencies, and continuously keeps the CMDB up to date—ensuring incidents are managed with the right context and accuracy.
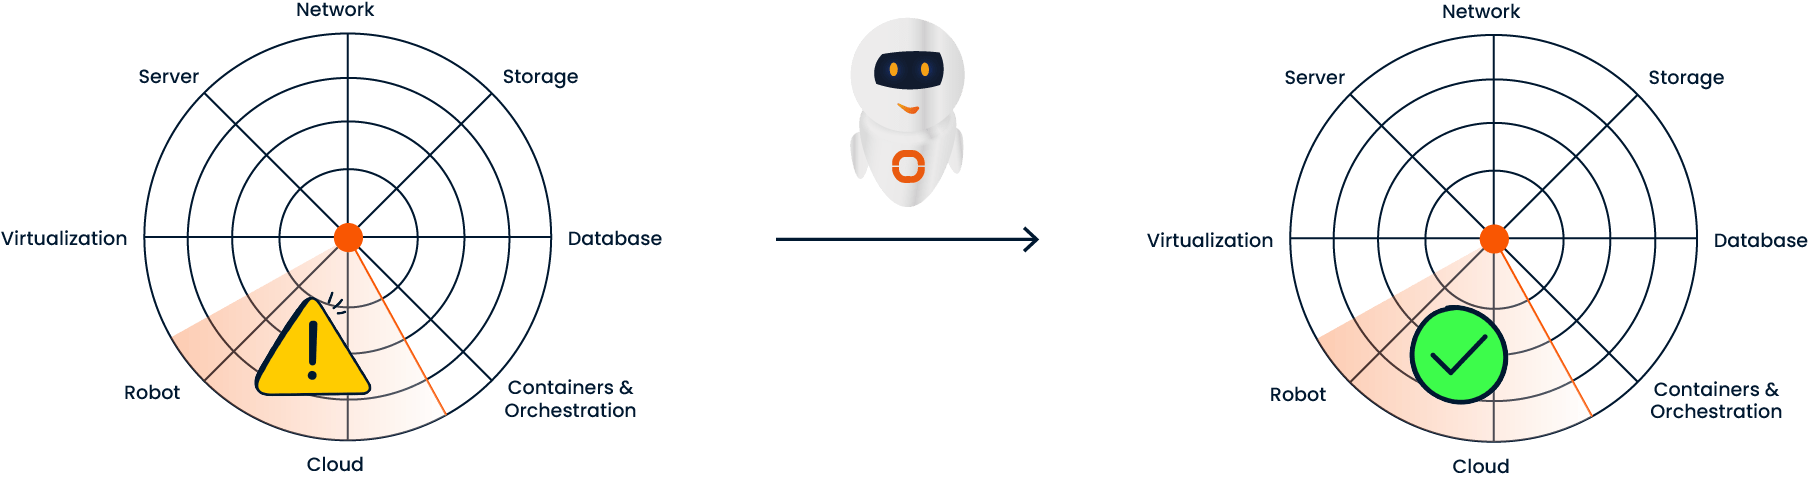
Utilizing predefined rules and AI-driven scenarios, ODYA Automated NOC automates incident response actions. When previously encountered and documented “known issues” occur, the system instantly applies the corresponding “known solutions.”
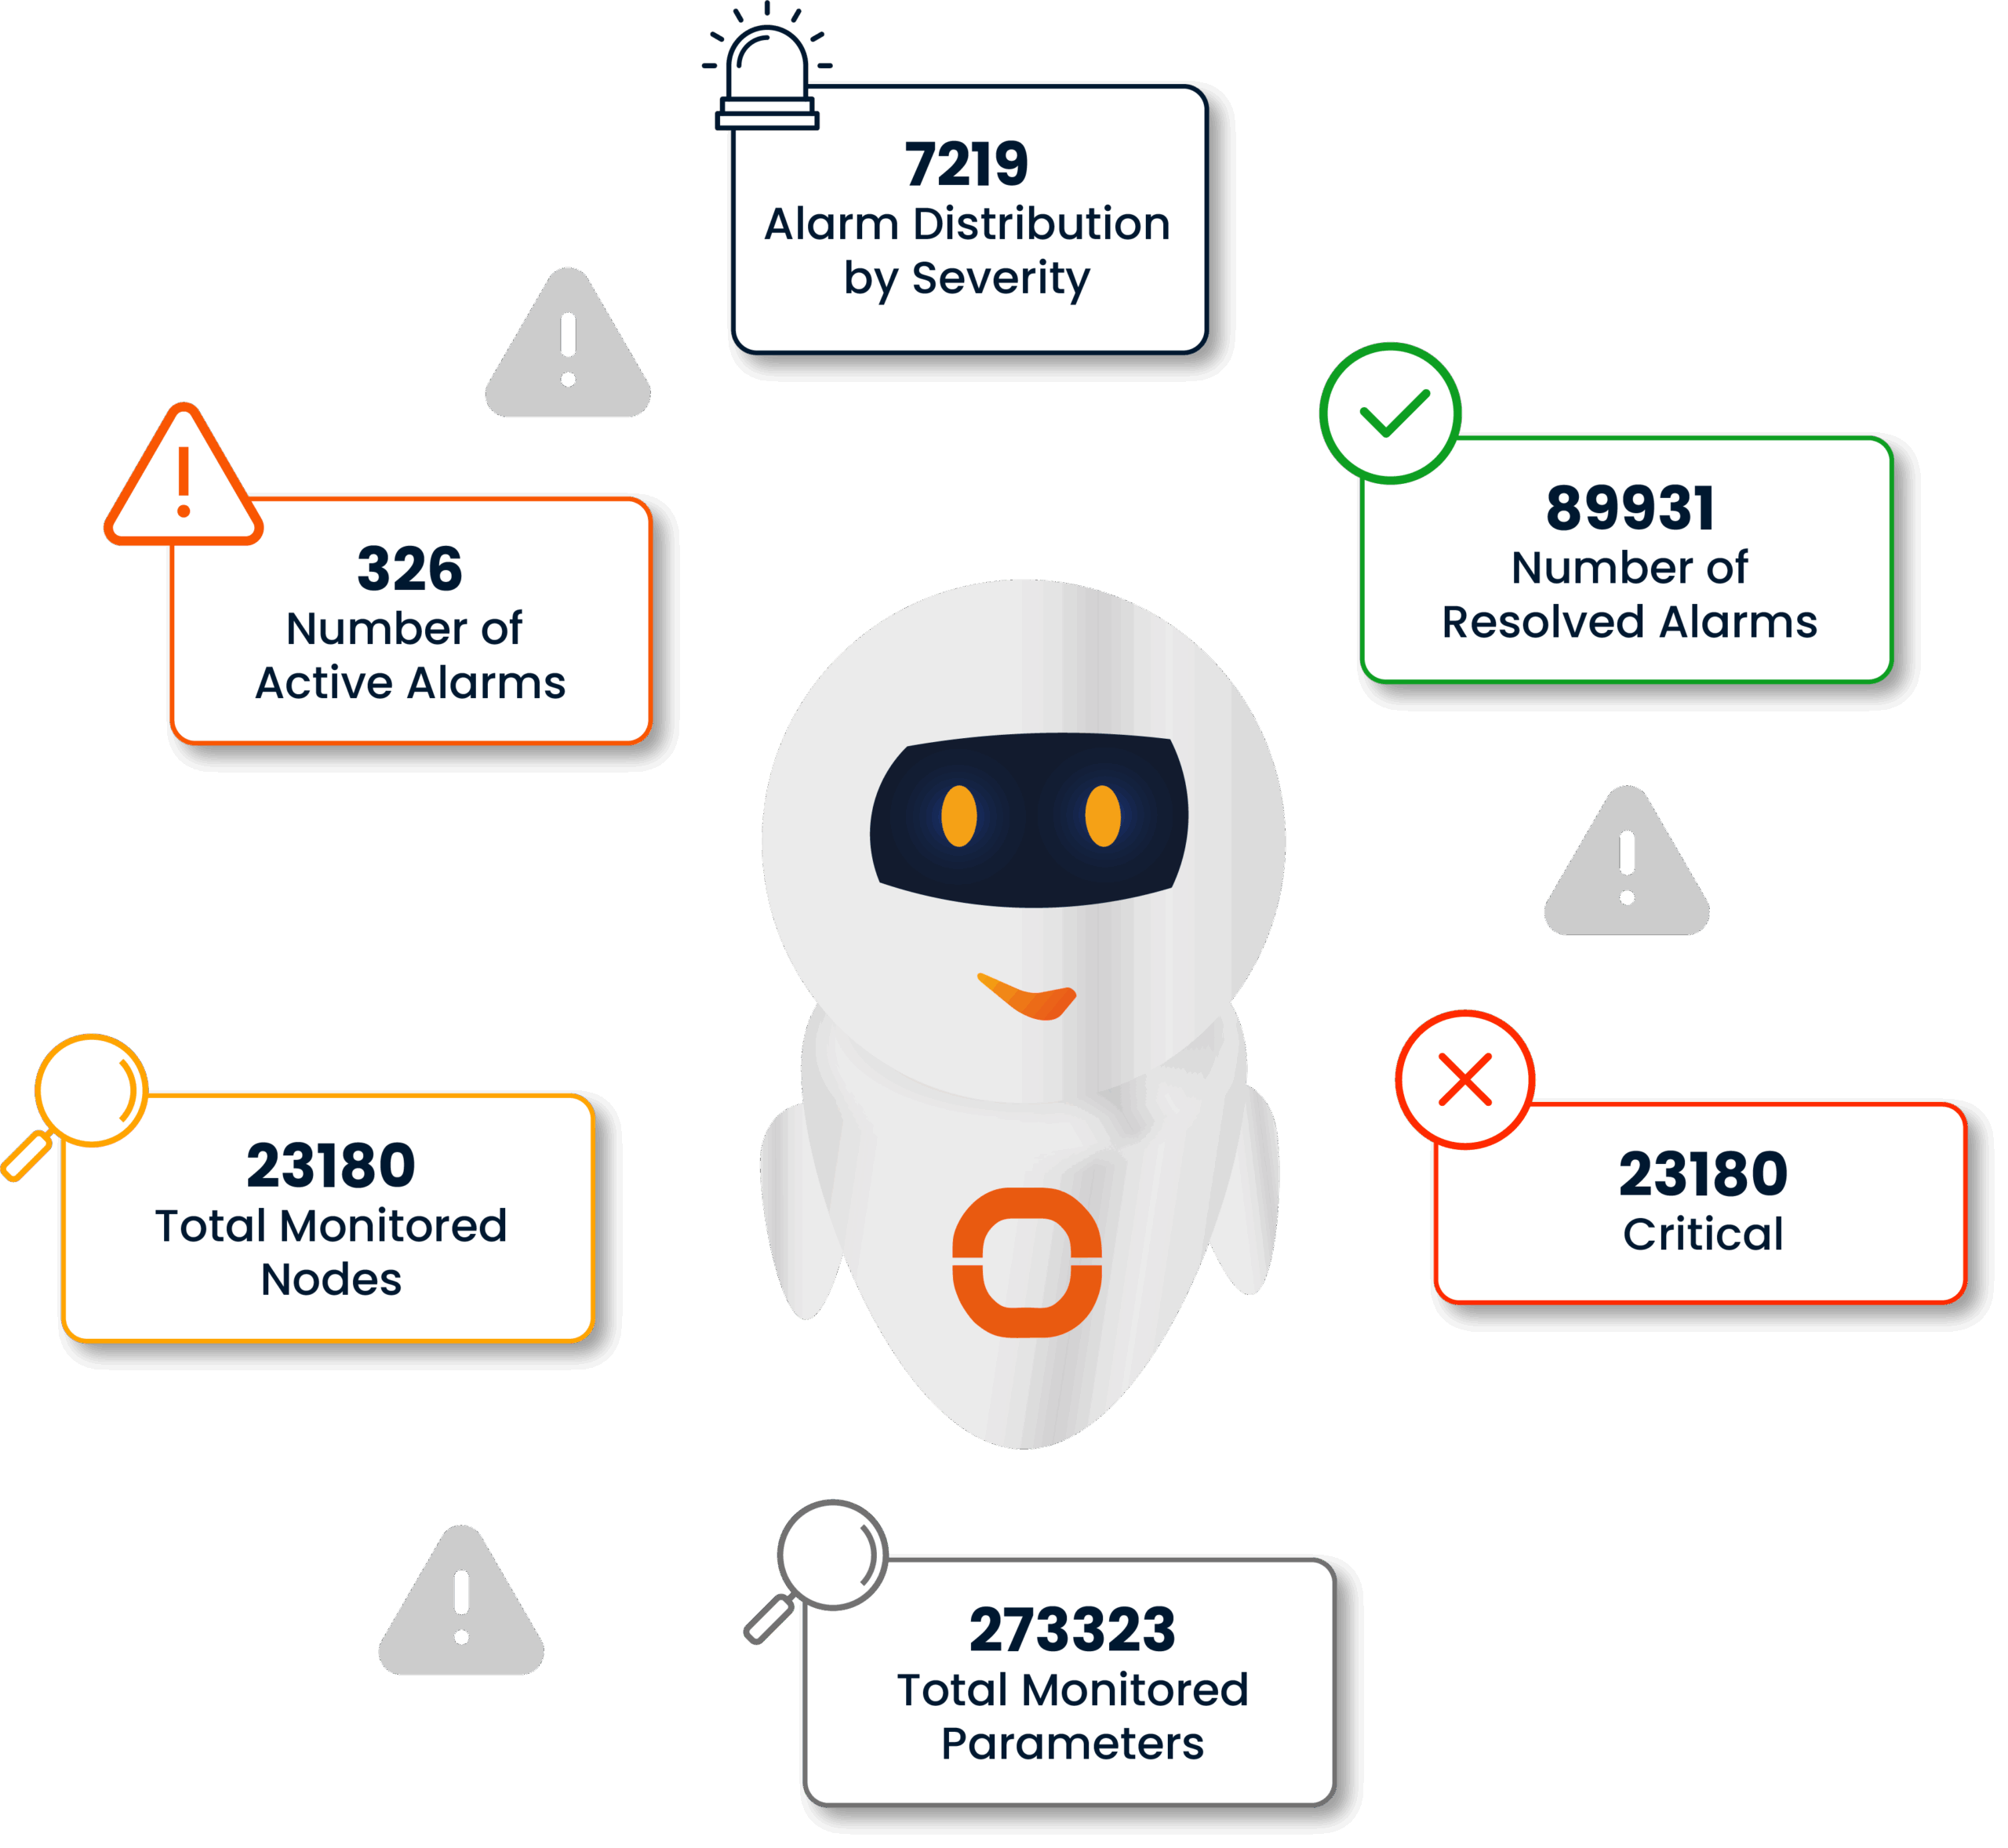
ODYA Automated NOC aggregates, analyzes, and generates insights from large volumes of logs, metrics, event records, and performance data collected from various systems, providing a single source of truth for your IT operations.
Through proactive monitoring and advanced root cause analysis capabilities, it not only identifies issues but also prevents recurring or similar incidents in the future.
Within 24/7 NOC services, reporting and documentation represent a structured and comprehensive process that underpins incident management, SLA monitoring, performance evaluation, CI health, and effective knowledge sharing. This function is essential for maintaining operational transparency, providing a clear overview of system status, and facilitating thorough root cause analysis of potential issues.
The platform is delivered as SaaS. With a hybrid model, infrastructure remains on the customer side while all operations run in the cloud.
Detailed analysis reports to reduce alarms to a single root cause and action recommendations to prevent recurrence.
Incoming alarms are enriched with CI information, historical data, and action sets to enable prioritization.
Live dashboard displaying the current status of the entire infrastructure, including alarm counts and topology view.
Ability to automatically resolve known issues without human intervention. Example: disk full → log cleanup, service stopped → restart.
Automatically escalates unresolved incidents based on defined time thresholds or severity levels.
Detailed analysis reports to consolidate alarms into a single root cause and provide action recommendations to prevent repetition.
Drag-and-drop visual report builder to design and automate organization-specific reports.
Identification of CIs that have not sent signals for a long time and cause unnecessary license consumption.
TLS 1.3 encryption in transit, AES-256 encryption at rest, and GDPR/KVKK-compliant data protection.
Widget-based visual dashboards tailored to each user’s or team’s workflow.
Lightweight agent deployed in the customer environment that integrates with existing tools, enabling secure bi-directional communication.
Central inventory of all IT assets including servers, networks, services, and applications, with automatic CI-alarm mapping.
Automatically groups related alarms to reduce noise and enable faster root cause identification.
Alarm notifications via SMS, voice call, escalation call chains, email, and webhook for immediate response.
Smart alarm closure mechanism. The system automatically verifies whether the issue has truly been resolved and closes the alarm.
In-platform communication between the NOC team and customers. Centralized tracking of ticket comments and status updates.
MTTR, MTTA, alarm volume trends, noisiest CIs, and resolution rate charts for comprehensive reporting.
Tracking of service level objectives including uptime percentage, response time, and resolution time metrics.
Authorization based on user roles. Admin, NOC Engineer, Read-Only, and custom roles can be defined.
Each customer’s data is stored in a fully isolated environment, preventing cross-tenant data leakage.
Executive-level reports and dashboards, CI-based alarm distributions, critical metrics, and real-time health status.
Ready-made connectors for 10+ monitoring platforms with REST API and webhook-based integration.
Tracking heterogeneous alarms from different sources in a single interface with a standardized structure.
Unlimited historical storage of all alarms with fast access and comparison of past incidents.
Rule-based action sets. Workflow definitions such as "When X alarm occurs, execute Y action."
Continuous monitoring and intervention service provided by certified experts (L0, L1, L2).
Action Sets, SOPs, and troubleshooting guides for known issues and known resolution steps.
Daily health check, weekly summary, monthly SLA report, with Excel and HTML output.
Analysis of alarm patterns over time to detect anomalies and generate predictive alerts.
Immutable logging of all user activities for compliance audits and forensic analysis.
User interface optimized for desktop, tablet, and mobile devices.
Pricing based on the number of monitored devices. Scalable and predictable cost model.
Your IT Infrastructure Never Sleeps: 24/7 Smart Monitoring! NOC & IT Operations & Smart Monitoring AI-supported automation, proactive alarm management, and L0–L2 techni
What Are the Main Types of IT Anomalies? How Does ODYA Automated NOC Detect and Resolve Them? Table of Contents Alert management in modern IT infrastructures has long surpas
Monitoring and Alarm Management: No Longer Reactive, But Smart and Proactive ! Table of Contents Finding a real incident in the nightly flood of alerts is like searching for
What Is Ticket Enrichment? How Smart Ticket Enrichment Helps Problem Management? Table of Contents When a support ticket arrives and contains only a few lines of text, your
24/7 Incident Detection and Reporting: Why is it critical? İçindekiler Continuous monitoring in modern IT infrastructures is no longer a luxury, but a necessity. With ODYA
How Does Tool Sprawl Slow Down NOC Operations? Table of Contents Monitoring tool sprawl has become one of the most critical yet often overlooked challenges in modern IT oper
From On-Call Management to Playbook Automation: The Strategic Shift in IT Table of Contents Setting up an on-call management rotation is a starting point not a destination.
Noise Reduction with Alarm Correlation One of the greatest challenges in modern IT infrastructures is getting lost in the excessive number of alarms generated by systems. Every com
Without Event Correlation, Simply Silencing the Alarm Is Not Enough! İçindekiler Alarm correlation reduces alarm noise. Event correlation, on the other hand, identifies th
Servers, network devices (switches, routers, firewalls), databases, applications, virtualization environments, cloud services, and other systems that affect critical business processes are monitored. Physical devices or IoT systems in facilities can also be added when required.
When an alarm is triggered, the NOC team is automatically notified. L0, L1, and L2 level interventions are applied:
Through alarm filtering and prioritization, only critical and real-time alerts are delivered to the team. Unnecessary or repetitive alarms are blocked, enabling the team to focus only on important incidents.
All alarms and incidents are recorded in a central system. Recurring problems are analyzed, root causes are identified, and coordination with relevant teams is ensured to provide long-term solutions.
Monthly and on-demand custom reports are provided. Trend analysis, capacity planning, and SLA reporting are performed to monitor and report the overall status of your infrastructure in detail.
SolarWinds, Zabbix, Nagios, Splunk, and other industry-standard monitoring tools are used. Tools are customized to fit the organization’s infrastructure, and integration between multiple platforms is provided.
Application performance monitors and user experience monitoring tools are used to track system response times, availability, and performance metrics. Issues are detected and resolved in real time.
An SLA (Service Level Agreement) guarantees how reliable the service is and the response time for issues. Example: intervention within 15 minutes for a critical alarm, 99.9% uptime guarantee.
All incidents are logged by the system, and response times are measured according to the SLA. Reports are regularly provided to the customer, and performance is continuously monitored.
From IT to the field, discover the end-to-end monitoring and seamless control solutions you need—straight from our team!