






What Is API Monitoring? Why Should APIs Be Monitored?
What Is API Monitoring? Why Should APIs Be Monitored? API Monitoring API Monitoring is the continuous and automated measurement of the availability, performance, and correctness of



What Is API Monitoring? Why Should APIs Be Monitored? API Monitoring API Monitoring is the continuous and automated measurement of the availability, performance, and correctness of
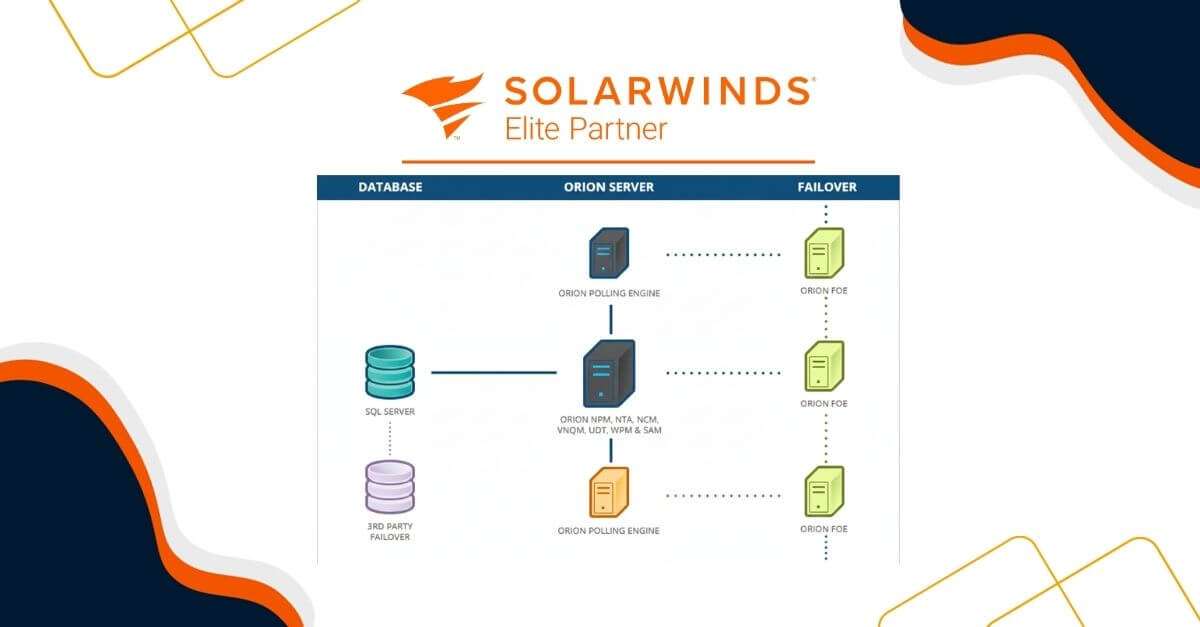
High Availability (HA): Don’t Let a Single Failure Shut Down the Entire Operation! Observability & SolarWinds High Availability (HA) With High Availability (HA), your monitor

SolarWinds SentryOne (SQL Sentry) or Database Performance Analyzer? SolarWınds sentryone (SQL Sentry)·Database Performance Analyzer · Comparison There are two different database

Causal Graphs: The New Language of Root Cause Analysis in Monitoring and Observability Causal Graphs & Monitoring & Observability An alarm goes off in the production enviro

Smart Ways to Reduce MTTR in Incident Management ITSM · Incident Management · Reduce MTTR In IT operations, where every minute counts, how long it takes to resolve an incident is

ODYA Managed Services: How Do We Manage Your IT Operations? ODYA Managed Services — Technical Framework We transform your infrastructure into a predictable, measurable, and effic

Network Visibility: 5 Critical Mistakes and the Problems They Cause In modern IT infrastructures, network visibility plays a crucial role in ensuring system continuity and prev

What Is Bandwidth and Why Is Bandwidth Monitoring Critical? We have a bandwidth issue” is one of the most frequently heard statements within IT teams today. However, more often t

What Is SD-WAN? Why SD-WAN Monitoring Is Matters? SD-WAN (Software-Defined Wide Area Network) is a modern networking technology that introduces a software-driven approach to managi

+90 216 577 5320

info@odya.com.tr

Barbaros Mah. Begonya Sok. No: 3 NİDA Kule Kuzey Kat: 12 Ofis:133, 34746 Ataşehir/İstanbul
BİRUNİ Teknopark – Kazlıçeşme Mah. 245.Sok. No:5 Zeytinburnu/İstanbul